1812 United States presidential election in Pennsylvania|
|
|
|
|
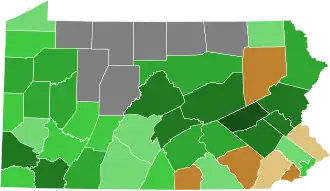
Madison
50–60%
60–70%
70–80%
80–90%
90–100%
|
Clinton
50–60%
60–70%
| |
|
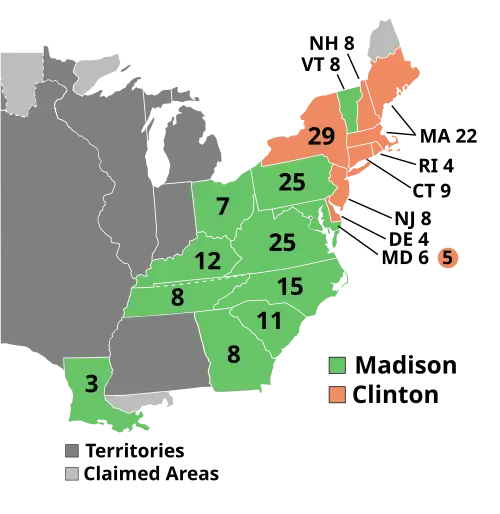
The 1812 United States presidential election in Pennsylvania took place as part of the 1812 United States presidential election. Voters chose 25 representatives, or electors to the Electoral College,[1] who voted for President and Vice President.
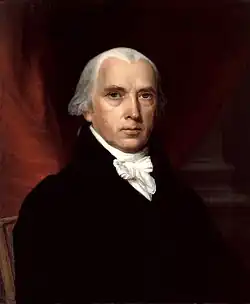
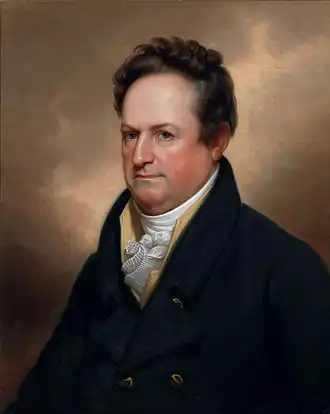
Pennsylvania voted for the Democratic-Republican candidate, James Madison, over the Federalist candidate, DeWitt Clinton. Madison won Pennsylvania by a margin of 25.2%.
Results
Note: Election results totals only include known numbers, as verified by the source. Vote totals from several counties are missing/unknown.
County results
| County
|
James Madison
Democratic-Republican
|
DeWitt Clinton
Federalist
|
Total votes cast
|
| %
|
#
|
%
|
#
|
| Adams |
35.47% |
410 |
64.53% |
746 |
1,156
|
| Allegheny |
59.96% |
966 |
40.04% |
645 |
1,611
|
| Armstrong |
70.35% |
121 |
29.65% |
51 |
172
|
| Beaver[3] |
62.37% |
383 |
37.62% |
231 |
614
|
| Bedford |
56.20% |
721 |
43.80% |
562 |
1,283
|
| Berks |
81.36% |
3,025 |
18.64% |
693 |
3,718
|
| Bucks |
49.03% |
2,184 |
50.97% |
2,270 |
4,454
|
| Butler |
79.96% |
375 |
20.04% |
94 |
469
|
| Cambria |
64.03% |
89 |
35.97% |
50 |
139
|
| Centre |
85.33% |
1,239 |
14.67% |
213 |
1,452
|
| Chester |
47.28% |
2,788 |
52.72% |
3,109 |
5,897
|
| Crawford |
74.64% |
2,455 |
25.36% |
834 |
3,289
|
| Cumberland |
63.29% |
269 |
36.71% |
156 |
425
|
| Dauphin |
77.10% |
1,842 |
22.90% |
547 |
2,389
|
| Dauphin (late return) |
95.56% |
86 |
4.44% |
4 |
90
|
| Delaware |
32.58% |
592 |
67.42% |
1,225 |
1,817
|
| Erie |
54.09% |
152 |
45.91% |
129 |
281
|
| Fayette |
83.60% |
999 |
16.40% |
196 |
1,195
|
| Franklin |
66.89% |
1,513 |
33.11% |
749 |
2,262
|
| Greene |
64.98% |
425 |
35.02% |
229 |
654
|
| Huntingdon |
51.11% |
712 |
48.89% |
681 |
1,393
|
| Indiana[3] |
62.27% |
137 |
37.73% |
83 |
220
|
| Lancaster |
39.32% |
2,438 |
60.68% |
3,762 |
6,200
|
| Lehigh |
82.53% |
1,039 |
17.47% |
220 |
1,259
|
| Luzerne |
36.41% |
713 |
63.59% |
1,245 |
1,958
|
| Lycoming |
72.38% |
933 |
27.62% |
356 |
1,289
|
| Mercer |
79.27% |
367 |
20.73% |
96 |
463
|
| Mifflin |
89.54% |
1,053 |
10.46% |
123 |
1,176
|
| Montgomery |
59.12% |
2,623 |
40.88% |
1,814 |
4,437
|
| Northampton |
80.10% |
1,554 |
19.90% |
386 |
1,940
|
| Northumberland |
85.14% |
3,415 |
14.86% |
596 |
4,011
|
| Philadelphia |
60.11% |
6,987 |
39.89% |
4,637 |
11,624
|
| Susquehanna |
82.76% |
725 |
17.24% |
151 |
876
|
| Somerset |
71.89% |
422 |
28.11% |
165 |
587
|
| Venango & Warren |
78.44% |
131 |
21.56% |
36 |
167
|
| Washington |
84.57% |
2,334 |
15.43% |
426 |
2,760
|
| Wayne |
74.44% |
297 |
25.56% |
102 |
399
|
| Westmoreland |
63.96% |
818 |
36.04% |
461 |
1,279
|
| York |
59.77% |
2,090 |
40.23% |
1,407 |
3,497
|
| Source: [2]
|
See also
Notes
- ^ While commonly labeled as the Federalist candidate, Clinton technically ran as a Democratic-Republican and was not nominated by the Federalist party itself, the latter simply deciding not to field a candidate. This did not prevent endorsements from state Federalist parties (such as in Pennsylvania), but he received the endorsement from the New York state Democratic-Republicans as well.
References