1924 Newfoundland general election
| |||||||||||||||||||||||||||||||||||||
36 seats of the Newfoundland and Labrador House of Assembly 19 seats needed for a majority | |||||||||||||||||||||||||||||||||||||
|---|---|---|---|---|---|---|---|---|---|---|---|---|---|---|---|---|---|---|---|---|---|---|---|---|---|---|---|---|---|---|---|---|---|---|---|---|---|
| |||||||||||||||||||||||||||||||||||||
| |||||||||||||||||||||||||||||||||||||
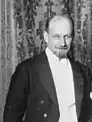
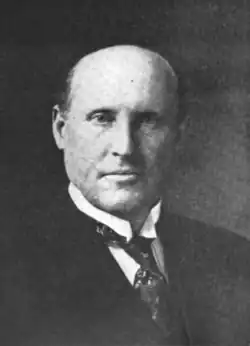
The 1924 Newfoundland general election was held on 2 June 1924 to elect members of the 26th General Assembly of Newfoundland in the Dominion of Newfoundland. The Liberal-Progressives and Liberal-Conservative Progressives were new parties formed as a result of the collapse of the ruling Liberal Reform Party. The Liberal-Conservative Progressives were led by Walter Stanley Monroe and won the election weeks after the party's creation. During his time in office, Monroe alienated a number of his supporters: Peter J. Cashin, F. Gordon Bradley, C. E. Russell, Phillip F. Moore, Lewis Little and H.B.C. Lake, who all defected to the opposition Liberal-Progressive Party. In 1925, universal suffrage was introduced in Newfoundland: women aged 25 and older were allowed to vote (men could vote at the age of 21).[1] Monroe was replaced by Frederick C. Alderdice as Prime Minister in August 1928.
Results
| Party | Leader | 1923 | Candidates | Seats won | Seat change | % of seats (% change) |
Popular vote | % of vote (% change) | |
|---|---|---|---|---|---|---|---|---|---|
| Liberal-Conservative Progressive | Walter Monroe | 13[b] | 36 | 25 | 69.44% ( |
57,391 | 57.94% ( | ||
| Liberal-Progressive | Albert Hickman | 23[c] | 36 | 10 | 27.78% ( |
40,492 | 40.88% ( | ||
| Other | 0 | 1 | 1 | 2.78% ( |
1,166 | 1.18% ( | |||
| Totals | 36 | 73 | 36 | 100% | 99,049 | 100% | |||
Results by district
- Names in boldface type represent party leaders.
- † indicates that the incumbent did not run again.
- ‡ indicates that the incumbent ran in a different district.
St. John's
| Electoral district | Candidates | Incumbent | ||||
|---|---|---|---|---|---|---|
| Liberal-Conservative | Liberal-Progressive | |||||
| St. John's East | William Higgins 3,654 26.49% |
Michael Caul[2] 1,088 7.89% |
William Higgins | |||
| Cyril Fox 3,557 25.79% |
Charles Ryan[2] 1,081 7.84% |
Cyril Fox | ||||
| Nicholas Vinnicombe 3,375 24.47% |
Lewis Edward Emerson 1,039 7.53% |
Nicholas Vinnicombe | ||||
| St. John's West[2] | John Crosbie 3,298 23.36% |
Joseph Fitzgibbon 1,676 11.87% |
Charles Hunt† | |||
| William Browne 3,115 22.06% |
Reg Dowden[2] 1,661 11.77% |
Michael Cashin† | ||||
| William Linegar 3,009 21.31% |
Andrew Duffy[2] 1,359 9.63% |
Richard Squires† | ||||
Conception Bay
| Electoral district | Candidates | Incumbent | ||||
|---|---|---|---|---|---|---|
| Liberal-Conservative | Liberal-Progressive | |||||
| Bay de Verde | Richard Cramm 1,025 28.77% |
William Cave 851 23.88% |
William Cave | |||
| John Puddester 979 27.48% |
Wallace Goobie 708 19.87% |
Richard Cramm | ||||
| Carbonear | John Rorke Jr. 358 45.84% |
Robert Duff 423 54.16% |
James Moore† | |||
| Harbour Grace | John R. Bennett 1,034 17.41% |
Albert Hickman 1,049 17.66% |
Archibald Piccott† | |||
| Charles Russell 1,014 17.07% |
Frank Archibald 957 16.11% |
Ernest Simmons | ||||
| Ernest Simmons 947 15.95% |
Augustus Calpin 938 15.79% |
Augustus Calpin | ||||
| Harbour Main | William Woodford 884 31.56% |
Matthew Hawco 628 22.42% |
Matthew Hawco | |||
| Cyril Cahill 785 28.03% |
Leo Carter[3] 504 17.99% |
William Woodford | ||||
| Port de Grave | F. Gordon Bradley 524 50.24% |
Robert Smith 519 49.76% |
Harry A. Winter† | |||
Avalon Peninsula
| Electoral district | Candidates | Incumbent | ||||
|---|---|---|---|---|---|---|
| Liberal-Conservative | Liberal-Progressive | |||||
| Ferryland | Peter Cashin 1,016 39.55% |
Joseph P. Burke 384 14.95% |
Peter Cashin | |||
| Philip Moore 847 32.97% |
Thomas Coady[4] 322 12.53% |
Philip Moore | ||||
| Placentia and St. Mary's | Michael Sullivan 2,523 29.10% |
James Bindon 916 10.57% |
Michael Sullivan | |||
| William Walsh 2,448 28.24% |
P. J. Murphy 473 5.46% |
William Walsh | ||||
| Edward Sinnott 1,917 22.11% |
M. J. Ryan 392 4.52% |
Edward Sinnott | ||||
Eastern Newfoundland
| Electoral district | Candidates | Incumbent | ||||
|---|---|---|---|---|---|---|
| Liberal-Conservative | Liberal-Progressive | |||||
| Bonavista | Walter Monroe 2,330 18.06% |
Chesley Forbes 2,056 15.93% |
William Coaker† | |||
| Lewis Little 2,264 17.54% |
Arthur Barnes 2,003 15.52% |
Robert G. Winsor† | ||||
| William C. Winsor 2,258 17.50% |
Leonard Stick 1,994 15.45% |
John Abbott† | ||||
| Trinity | Harold Mitchell 1,388 15.19% |
William Halfyard 1,814 19.85% |
William Halfyard | |||
| William A. King[5] 1,336 14.62% |
Isaac Randell 1,697 18.57% |
Isaac Randell | ||||
| Arch Tait[5] 1,257 13.76% |
Edwin Godden 1,645 18.00% |
Richard Hibbs‡ (ran in Fogo) | ||||
Central Newfoundland
| Electoral district | Candidates | Incumbent | ||||
|---|---|---|---|---|---|---|
| Liberal-Conservative | Liberal-Progressive | |||||
| Fogo | Martin G. Dalton 683 44.29% |
Richard Hibbs 859 55.70% |
George Grimes‡ (ran in Twillingate) | |||
| Twillingate | James S. Ayre 1,737 14.86% |
Kenneth Brown 2,532 21.67% |
Kenneth Brown | |||
| Walter B. Milley 1,556 13.31% |
George Grimes 2,219 18.99% |
Arthur Barnes‡ (ran in Bonavista) | ||||
| Joseph Peters 1,437 12.30% |
Thomas Ashbourne 2,205 18.87% |
George Jones† | ||||
Southern and Western Newfoundland
| Electoral district | Candidates | Incumbent | ||||||
|---|---|---|---|---|---|---|---|---|
| Liberal-Conservative | Liberal-Progressive | Other | ||||||
| Burgeo and LaPoile | Walter Chambers 791 59.56% |
Harvey Small 537 40.44% |
Harvey Small | |||||
| Burin | H. B. C. Lake 871 25.63% |
George Harris 850 25.01% |
George Harris | |||||
| J. J. Long 860 25.30% |
Marmaduke Winter 818 24.07% |
Samuel Foote† | ||||||
| Fortune Bay | Charles Jeffrey 131 9.24% |
Frederick Lukins 120 8.47% |
William Warren 1,166 82.29% |
William Warren | ||||
| St. Barbe | Joseph Moore[6] 1,120 49.56% |
J. H. Scammell 1,140 50.44% |
J. H. Scammell | |||||
| St. George's | Thomas Power 1,063 50.67% |
Joseph Downey 1,035 49.33% |
Joseph Downey | |||||
Notes
- ^ a b Not the incumbent, but stood in this district and won
- ^ a b As the Liberal-Labour-Progressive Party
- ^ a b As the Liberal Reform Party in a coalition with the Fishermen's Protective Union
References
- ^ "Women's Suffrage". www.heritage.nf.ca. Retrieved October 29, 2019.
- ^ a b c d e "Candidates Nominated for St. John's East and West". The Telegram. May 23, 1924. Retrieved May 9, 2025.
- ^ "Hawco and Carter For Harbor Main". Evening Advocate. May 19, 1924. Retrieved May 9, 2025.
- ^ "Election Returns". The Western Star. June 6, 1924. Retrieved May 9, 2025.
- ^ a b "Monroe Standard Bearers: Pledged to a "Clean Up and Keep Clean" Policy". Daily News. May 20, 1924. Retrieved May 9, 2025.
- ^ "From the Firing Line: St. Barbe Will Return Moore". Evening Telegram. May 20, 1924. Retrieved May 9, 2025.
Further reading
- Riggs, Bert (1981). "General Election #26: June 2, 1924". Encyclopedia of Newfoundland and Labrador, volume 1. St. John's: Harry Cuff Publications Ltd. Retrieved May 4, 2025.
| General elections | |
|---|---|
| Local elections | |
| Referendums | |
| Federal elections | |