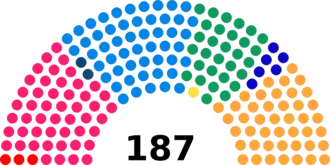
Federal elections were held in Switzerland on 25 October 1931.[1][2] Although the Social Democratic Party received the most votes, the Free Democratic Party remained the largest party in the National Council, winning 52 of the 187 seats.[3]
Results
National Council
 |
|---|
| Party | Votes | % | Seats | +/– |
|---|
| Social Democratic Party | 247,946 | 28.72 | 49 | –1 |
| Free Democratic Party | 232,562 | 26.94 | 52 | –6 |
| Conservative People's Party | 184,602 | 21.38 | 44 | –2 |
| Party of Farmers, Traders and Independents | 131,809 | 15.27 | 30 | –1 |
| Liberal Democratic Party | 24,573 | 2.85 | 6 | 0 |
| Communist Party | 12,778 | 1.48 | 2 | 0 |
| Social-Political Group | 10,726 | 1.24 | 2 | –1 |
| Evangelical People's Party | 8,454 | 0.98 | 1 | 0 |
| Communist Party Opposition | 9,841 | 1.14 | 1 | New |
| Other parties | 0 | – |
| Total | 863,291 | 100.00 | 187 | –11 |
|
| Valid votes | 863,291 | 97.89 | |
|---|
| Invalid/blank votes | 18,645 | 2.11 | |
|---|
| Total votes | 881,936 | 100.00 | |
|---|
| Registered voters/turnout | 1,118,841 | 78.83 | |
|---|
| Source: Nohlen & Stöver |
By constituency
| Constituency
|
Seats
|
Electorate
|
Turnout
|
Party
|
Votes
|
Seats
won
|
| Aargau
|
12
|
68,872
|
62,316
|
|
Social Democratic Party
|
255,276
|
4
|
|
|
Conservative People's Party
|
161,958
|
3
|
|
|
Party of Farmers, Traders and Independents
|
161,683
|
3
|
|
|
Free Democratic Party
|
143,225
|
2
|
|
|
Communist Party
|
6,105
|
0
|
| Appenzell Ausserrhoden
|
2
|
13,125
|
10,115
|
|
Free Democratic Party
|
10,717
|
1
|
|
|
Social Democratic Party
|
6,046
|
1
|
|
|
Independent List
|
2,143
|
0
|
| Appenzell Innerrhoden
|
1
|
3,306
|
1,701
|
|
Conservative People's Party
|
1,355
|
1
|
| Basel-Landschaft
|
4
|
25,236
|
15,748
|
|
Social Democratic Party
|
23,051
|
1
|
|
|
Free Democratic Party
|
18,292
|
2
|
|
|
Party of Farmers, Traders and Independents
|
9,444
|
1
|
|
|
Conservative People's Party
|
7,664
|
0
|
|
|
Communist Party
|
3,143
|
0
|
| Basel-Stadt
|
7
|
43,535
|
28,732
|
|
Social Democratic Party
|
62,464
|
2
|
|
|
Communist Party
|
30,084
|
1
|
|
|
Free Democratic Party
|
30,044
|
1
|
|
|
Liberal Democratic Party
|
25,258
|
1
|
|
|
Conservative People's Party
|
23,502
|
1
|
|
|
Party of Farmers, Traders and Independents
|
20,967
|
1
|
|
|
Evangelical People's Party
|
6,801
|
0
|
| Bern
|
31
|
197,392
|
156,998
|
|
Party of Farmers, Traders and Independents
|
2,082,207
|
15
|
|
|
Social Democratic Party
|
1,618,792
|
10
|
|
|
Free Democratic Party
|
817,738
|
5
|
|
|
Conservative People's Party
|
276,736
|
1
|
|
|
Communist Party
|
10,305
|
0
|
| Fribourg
|
7
|
37,447
|
31,337
|
|
Conservative People's Party
|
146,564
|
6
|
|
|
Free Democratic Party
|
45,078
|
1
|
|
|
Social Democratic Party
|
16,843
|
0
|
|
|
Party of Farmers, Traders and Independents
|
9,157
|
0
|
| Geneva
|
8
|
45,829
|
26,496
|
|
Free Democratic Party
|
86,202
|
2
|
|
|
Social Democratic Party
|
84,916
|
4
|
|
|
Liberal Democratic Party
|
29,743
|
1
|
|
|
Conservative People's Party
|
24,261
|
1
|
|
|
National Political Order
|
20,904
|
0
|
|
|
Union of Economic Defence and National Action
|
10,769
|
0
|
|
|
Communist Party
|
2,058
|
0
|
| Glarus
|
2
|
9,742
|
7,826
|
|
Free Democratic Party
|
5,951
|
1
|
|
|
Social-Political Group
|
3,725
|
1
|
|
|
Social Democratic Party
|
3,708
|
0
|
|
|
Conservative People's Party
|
1,875
|
0
|
| Grisons
|
6
|
31,867
|
25,212
|
|
Conservative People's Party
|
55,469
|
2
|
|
|
Free Democratic Party
|
40,081
|
2
|
|
|
Social-Political Group
|
28,203
|
1
|
|
|
Social Democratic Party
|
24,765
|
1
|
| Lucerne
|
9
|
52,702
|
46,672
|
|
Conservative People's Party
|
205,122
|
4
|
|
|
Free Democratic Party
|
161,805
|
3
|
|
|
Social Democratic Party
|
46,728
|
1
|
|
|
Communist Party
|
982
|
0
|
| Neuchâtel
|
6
|
35,930
|
27,597
|
|
Social Democratic Party
|
72,158
|
3
|
|
|
Free Democratic Party
|
41,386
|
2
|
|
|
Liberal Democratic Party
|
30,511
|
1
|
|
|
National Progressive Party
|
14,124
|
0
|
|
|
Social-Political Group
|
4,542
|
0
|
|
|
Communist Party
|
1,179
|
0
|
| Nidwalden
|
1
|
3,850
|
1,047
|
|
Conservative People's Party
|
965
|
1
|
| Obwalden
|
1
|
4,975
|
1,247
|
|
Conservative People's Party
|
1,122
|
1
|
| Schaffhausen
|
2
|
17,106
|
15,143
|
|
Social Democratic Party
|
13,425
|
1
|
|
|
Free Democratic Party
|
8,610
|
1
|
|
|
Party of Farmers, Traders and Independents
|
4,625
|
0
|
|
|
Conservative People's Party
|
2,484
|
0
|
| Schwyz
|
3
|
17,088
|
13,919
|
|
Conservative People's Party
|
21,204
|
2
|
|
|
Free Democratic Party
|
11,603
|
1
|
|
|
Social Democratic Party
|
8,032
|
0
|
| Solothurn
|
7
|
40,432
|
35,932
|
|
Free Democratic Party
|
110,663
|
3
|
|
|
Social Democratic Party
|
71,073
|
2
|
|
|
Conservative People's Party
|
63,109
|
2
|
| St. Gallen
|
13
|
71,564
|
63,799
|
|
Conservative People's Party
|
351,573
|
6
|
|
|
Free Democratic Party
|
247,770
|
4
|
|
|
Social Democratic Party
|
173,719
|
3
|
|
|
Evangelical People's Party
|
21,164
|
0
|
|
|
Communist Party
|
2,961
|
0
|
| Ticino
|
7
|
39,004
|
27,792
|
|
Free Democratic Party
|
88,287
|
3
|
|
|
Conservative People's Party
|
77,530
|
3
|
|
|
Social Democratic Party
|
30,377
|
1
|
|
|
Communist Party
|
859
|
0
|
| Thurgau
|
6
|
35,759
|
30,499
|
|
Party of Farmers, Traders and Independents
|
61,404
|
3
|
|
|
Social Democratic Party
|
45,722
|
1
|
|
|
Conservative People's Party
|
34,632
|
1
|
|
|
Free Democratic Party
|
26,727
|
1
|
|
|
Social-Political Group
|
10,856
|
0
|
| Uri
|
1
|
5,879
|
2,618
|
|
Free Democratic Party
|
1,863
|
1
|
| Vaud
|
15
|
92,480
|
71,352
|
|
Free Democratic Party
|
457,401
|
7
|
|
|
Social Democratic Party
|
291,725
|
4
|
|
|
Liberal Democratic Party
|
182,423
|
3
|
|
|
Party of Farmers, Traders and Independents
|
102,386
|
1
|
|
|
Communist Party
|
7,577
|
0
|
| Valais
|
6
|
37,163
|
32,169
|
|
Conservative People's Party
|
131,242
|
5
|
|
|
Free Democratic Party
|
39,904
|
1
|
|
|
Social Democratic Party
|
21,130
|
0
|
| Zug
|
2
|
9,189
|
6,872
|
|
Conservative People's Party
|
6,225
|
1
|
|
|
Free Democratic Party
|
3,676
|
1
|
|
|
Social Democratic Party
|
3,430
|
0
|
| Zürich
|
28
|
184,189
|
141,350
|
|
Social Democratic Party
|
1,554,439
|
11
|
|
|
Party of Farmers, Traders and Independents
|
665,421
|
5
|
|
|
Free Democratic Party
|
592,596
|
5
|
|
|
Social-Political Group
|
408,802
|
3
|
|
|
Conservative People's Party
|
302,404
|
2
|
|
|
Evangelical People's Party
|
163,919
|
1
|
|
|
Communist Party
|
148,514
|
1
|
|
|
Federal Front
|
33,359
|
0
|
|
|
| Source: Bundesblatt, 2 December 1931
|
Council of States
In several cantons the members of the Council of States were chosen by the cantonal parliaments.[4]
By constituency
References
.svg.png)