1958 Blackpool Borough Council election
| |||||||||||||||||||||||||||||||||||||
14 of 56 seats to Blackpool County Borough Council 29 seats needed for a majority | |||||||||||||||||||||||||||||||||||||
|---|---|---|---|---|---|---|---|---|---|---|---|---|---|---|---|---|---|---|---|---|---|---|---|---|---|---|---|---|---|---|---|---|---|---|---|---|---|
| |||||||||||||||||||||||||||||||||||||
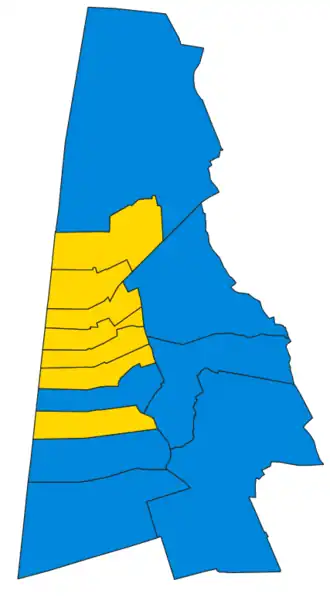 Map of results of 1958 election | |||||||||||||||||||||||||||||||||||||
| |||||||||||||||||||||||||||||||||||||
Elections to Blackpool Borough Council were held on Thursday, 8 May 1958. One third of the councillors seats were up for election, with each successful candidate to serve a three-year term of office. The council remained under no overall control.[1][2]
Election result
| Party | Votes | Seats | Full Council | |||||||
| Liberal Party | 15,848 (34.2%) | 7 (50.0%) | 7 / 14
|
26 (46.4%) | 26 / 56
| |||||
| Conservative Party | 19,440 (42.0%) | 7 (50.0%) | 7 / 14
|
24 (42.9%) | 24 / 56
| |||||
| Labour Party | 11,008 (23.8%) | 0 (0.0%) | 0 / 14
|
6 (10.7%) | 6 / 56
| |||||
Full council
| 6 | 26 | 24 |
Ward results
Alexandra
| Party | Candidate | Votes | % | ±% | |
|---|---|---|---|---|---|
| Liberal | N. B. Lole | 1,068 | 41.2 | ||
| Conservative | M. Samuels | 948 | 36.6 | ||
| Labour | P. Ladkin | 577 | 22.2 | ||
| Majority | 120 | 4.6 | |||
| Turnout | 2,593 | 49.8 | |||
| Liberal hold | Swing | ||||
Bank Hey
| Party | Candidate | Votes | % | ±% | |
|---|---|---|---|---|---|
| Liberal | L. F. Sharpe | 564 | 74.5 | ||
| Labour | E. Edwards | 193 | 25.5 | ||
| Majority | 371 | 49.0 | |||
| Turnout | 757 | 32.1 | |||
| Liberal hold | Swing | ||||
Bispham
| Party | Candidate | Votes | % | ±% | |
|---|---|---|---|---|---|
| Conservative | J. H. Smythe* | 3,838 | 53.5 | ||
| Liberal | H. Taylor | 2,224 | 31.0 | ||
| Labour | E. T. Sides | 1,109 | 15.5 | ||
| Majority | 1,614 | 22.5 | |||
| Turnout | 7,171 | 39.2 | |||
| Conservative hold | Swing | ||||
Brunswick
| Party | Candidate | Votes | % | ±% | |
|---|---|---|---|---|---|
| Liberal | J. P. Rodger | 917 | 50.0 | ||
| Conservative | L. Davis | 702 | 38.2 | ||
| Labour | L. Pattinson | 216 | 11.8 | ||
| Majority | 215 | 11.8 | |||
| Turnout | 1,835 | 43.7 | |||
| Liberal gain from Conservative | Swing | ||||
Claremont
| Party | Candidate | Votes | % | ±% | |
|---|---|---|---|---|---|
| Liberal | W. Briggs | 849 | 47.7 | ||
| Conservative | R. A. Fast | 617 | 34.7 | ||
| Labour | M. Allitt | 314 | 17.6 | ||
| Majority | 232 | 13.0 | |||
| Turnout | 1,780 | 45.0 | |||
| Liberal hold | Swing | ||||
Foxhall
| Party | Candidate | Votes | % | ±% | |
|---|---|---|---|---|---|
| Liberal | C. Cross* | 1,349 | 72.6 | ||
| Labour | M. Mason | 509 | 27.4 | ||
| Majority | 840 | 45.2 | |||
| Turnout | 1,858 | 35.7 | |||
| Liberal hold | Swing | ||||
Layton
| Party | Candidate | Votes | % | ±% | |
|---|---|---|---|---|---|
| Conservative | R. Jacobs | 2,205 | 41.2 | ||
| Liberal | J. A. Kenworthy* | 1,971 | 36.8 | ||
| Labour | J. Riley | 1,181 | 22.0 | ||
| Majority | 234 | 4.4 | |||
| Turnout | 5,357 | 36.7 | |||
| Conservative gain from Liberal | Swing | ||||
Marton
| Party | Candidate | Votes | % | ±% | |
|---|---|---|---|---|---|
| Conservative | J. S. Leigh | 1,963 | 50.3 | ||
| Labour | J. V. Brown | 1,022 | 26.2 | ||
| Liberal | W. Turner | 916 | 23.5 | ||
| Majority | 941 | 24.1 | |||
| Turnout | 3,901 | 44.9 | |||
| Conservative hold | Swing | ||||
Stanley
| Party | Candidate | Votes | % | ±% | |
|---|---|---|---|---|---|
| Conservative | A. Ashworth* | 2,829 | 50.3 | ||
| Labour | M. Riley | 2,800 | 49.7 | ||
| Majority | 29 | 0.6 | |||
| Turnout | 5,629 | 42.0 | |||
| Conservative hold | Swing | ||||
Talbot
| Party | Candidate | Votes | % | ±% | |
|---|---|---|---|---|---|
| Liberal | E. W. Seaman | 905 | 57.1 | ||
| Labour | S. H. Millward | 680 | 42.9 | ||
| Majority | 225 | 14.2 | |||
| Turnout | 1,585 | 40.0 | |||
| Liberal gain from Conservative | Swing | ||||
Tyldesley
| Party | Candidate | Votes | % | ±% | |
|---|---|---|---|---|---|
| Conservative | L. Pilkington* | 1,096 | 38.2 | ||
| Liberal | A. E. Harris | 954 | 33.3 | ||
| Labour | E. Watkin | 816 | 28.5 | ||
| Majority | 142 | 4.9 | |||
| Turnout | 2,866 | 48.1 | |||
| Conservative hold | Swing | ||||
Victoria
| Party | Candidate | Votes | % | ±% | |
|---|---|---|---|---|---|
| Conservative | R. Wall* | 1,337 | 43.4 | ||
| Labour | G. S. Benson | 910 | 29.5 | ||
| Liberal | G. H. H. Towse | 835 | 27.1 | ||
| Majority | 427 | 13.9 | |||
| Turnout | 3,082 | 41.3 | |||
| Conservative hold | Swing | ||||
Warbreck
| Party | Candidate | Votes | % | ±% | |
|---|---|---|---|---|---|
| Liberal | S. Rock | 1,260 | 50.8 | ||
| Conservative | W. C. Halton* | 1,196 | 49.2 | ||
| Majority | 64 | 2.6 | |||
| Turnout | 2,429 | 39.1 | |||
| Liberal gain from Conservative | Swing | ||||
Waterloo
| Party | Candidate | Votes | % | ±% | |
|---|---|---|---|---|---|
| Conservative | D. Lockwood* | 2,709 | 49.9 | ||
| Liberal | A. Green | 2,036 | 37.5 | ||
| Labour | D. Summerville | 681 | 12.6 | ||
| Majority | 673 | 12.4 | |||
| Turnout | 5,426 | 43.8 | |||
| Conservative hold | Swing | ||||
References
(1957 ←) | |
|---|---|
| County councils (England) |
|
| County councils (Wales) |
|