1959 Dutch general election|
|
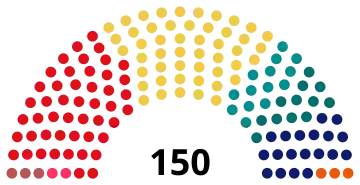
All 150 seats in the House of Representatives
76 seats needed for a majority |
| Turnout | 95.57% ( 0.07pp) 0.07pp) |
|---|
|
This lists parties that won seats. See the complete results below. 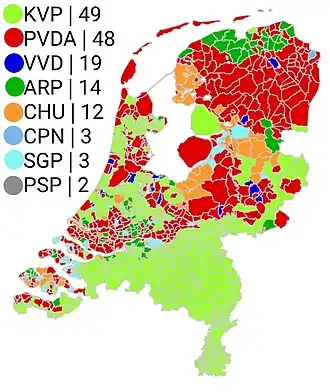 Most voted-for party by municipality |
|
General elections were held in the Netherlands on 12 March 1959.[1] The Catholic People's Party emerged as the largest party, winning 49 of the 150 seats in the House of Representatives.[2]
Results
 |
|---|
| Party | Votes | % | Seats | +/– |
|---|
| Catholic People's Party | 1,895,914 | 31.60 | 49 | 0 |
| Labour Party | 1,821,285 | 30.36 | 48 | –2 |
| People's Party for Freedom and Democracy | 732,658 | 12.21 | 19 | +6 |
| Anti-Revolutionary Party | 563,091 | 9.39 | 14 | –1 |
| Christian Historical Union | 486,429 | 8.11 | 12 | –1 |
| Communist Party of the Netherlands | 144,542 | 2.41 | 3 | –4 |
| Reformed Political Party | 129,678 | 2.16 | 3 | 0 |
| Pacifist Socialist Party | 110,499 | 1.84 | 2 | New |
| Reformed Political League | 39,972 | 0.67 | 0 | 0 |
| Farmers' Party | 39,423 | 0.66 | 0 | New |
| Brug Group | 34,723 | 0.58 | 0 | New |
| Positive Christian National Union | 1,317 | 0.02 | 0 | New |
| Total | 5,999,531 | 100.00 | 150 | 0 |
|
| Valid votes | 5,999,531 | 97.66 | |
|---|
| Invalid/blank votes | 143,878 | 2.34 | |
|---|
| Total votes | 6,143,409 | 100.00 | |
|---|
| Registered voters/turnout | 6,427,864 | 95.57 | |
|---|
| Source: CBS,[3] Nohlen & Stöver |
By province
References