1962 Sale Municipal Borough Council election
| |||||||||||||||||||||||||||||||||||||||||||||
9 of 32 seats to Sale Municipal Borough Council 16 seats needed for a majority | |||||||||||||||||||||||||||||||||||||||||||||
|---|---|---|---|---|---|---|---|---|---|---|---|---|---|---|---|---|---|---|---|---|---|---|---|---|---|---|---|---|---|---|---|---|---|---|---|---|---|---|---|---|---|---|---|---|---|
| |||||||||||||||||||||||||||||||||||||||||||||
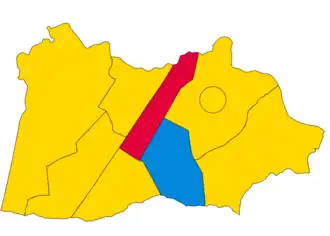 Map of results of 1962 election | |||||||||||||||||||||||||||||||||||||||||||||
| |||||||||||||||||||||||||||||||||||||||||||||
Elections to Sale Council were held on Thursday, 10 May 1962. One third of the councillors were up for election, with each successful candidate to serve a three-year term of office. The Conservative Party lost overall control of the council.[1][2]
Election result
| Party | Votes | Seats | Full Council | |||||||
| Conservative Party | 6,520 (33.9%) | 1 (11.1%) | 1 / 9
|
14 (43.8%) | 14 / 32
| |||||
| Liberal Party | 9,208 (47.9%) | 7 (77.8%) | 7 / 9
|
12 (37.5%) | 12 / 32
| |||||
| Labour Party | 3,510 (18.2%) | 1 (11.1%) | 1 / 9
|
6 (18.8%) | 6 / 32
| |||||
Full council
| 6 | 12 | 14 |
Aldermen
| 1 | 7 |
Councillors
| 5 | 12 | 7 |
Ward results
Brooklands
| Party | Candidate | Votes | % | ±% | |
|---|---|---|---|---|---|
| Liberal | E. E. Bradley | 1,176 | 55.8 | +9.6 | |
| Conservative | P. A. A. Pepper* | 931 | 44.2 | −9.6 | |
| Majority | 245 | 11.6 | |||
| Turnout | 2,107 | ||||
| Liberal gain from Conservative | Swing | ||||
Mersey
| Party | Candidate | Votes | % | ±% | |
|---|---|---|---|---|---|
| Liberal | A. Howarth* | 880 | 44.7 | −6.6 | |
| Conservative | F. Leigh | 758 | 38.5 | −10.2 | |
| Labour | D. Russell | 331 | 16.8 | −0.1 | |
| Majority | 122 | 6.2 | +3.6 | ||
| Turnout | 1,969 | ||||
| Liberal hold | Swing | ||||
St. Anne's
| Party | Candidate | Votes | % | ±% | |
|---|---|---|---|---|---|
| Liberal | E. M. Parker | 1,456 | 32.2 | ||
| Liberal | J. B. Sullivan | 1,208 | 26.7 | ||
| Conservative | F. S. Laughton* | 877 | 19.4 | ||
| Conservative | M. Schofield | 798 | 17.6 | ||
| Labour | K. B. McCaul | 188 | 4.1 | ||
| Majority | 331 | 7.3 | |||
| Turnout | 4,527 | ||||
| Liberal gain from Conservative | Swing | ||||
| Liberal gain from Conservative | Swing | ||||
St. John's
| Party | Candidate | Votes | % | ±% | |
|---|---|---|---|---|---|
| Conservative | S. P. Harris* | uncontested | |||
| Conservative hold | Swing | ||||
St. Martin's
| Party | Candidate | Votes | % | ±% | |
|---|---|---|---|---|---|
| Liberal | R. Lee | 1,374 | 36.9 | N/A | |
| Conservative | H. Jackson | 1,260 | 33.8 | −15.6 | |
| Labour | R. Mee | 1,094 | 29.3 | −21.3 | |
| Majority | 114 | 3.1 | |||
| Turnout | 3,728 | ||||
| Liberal gain from Conservative | Swing | ||||
St. Mary's
| Party | Candidate | Votes | % | ±% | |
|---|---|---|---|---|---|
| Liberal | G. A. Mitchell | 1,233 | 57.0 | +18.7 | |
| Conservative | M. Dickinson* | 930 | 43.0 | −18.7 | |
| Majority | 303 | 14.0 | |||
| Turnout | 2,163 | ||||
| Liberal gain from Conservative | Swing | ||||
St. Paul's
| Party | Candidate | Votes | % | ±% | |
|---|---|---|---|---|---|
| Labour | T. A. Winnington* | 614 | 37.4 | ||
| Liberal | J. Cooper | 524 | 31.9 | ||
| Conservative | D. Carrington-Brown | 504 | 30.7 | ||
| Majority | 90 | 5.5 | |||
| Turnout | 1,642 | ||||
| Labour hold | Swing | ||||
Sale Moor
| Party | Candidate | Votes | % | ±% | |
|---|---|---|---|---|---|
| Liberal | R. Newton | 1,357 | 43.7 | −7.4 | |
| Labour | W. L. Baddeley | 1,283 | 41.3 | −7.6 | |
| Conservative | C. Edwards | 463 | 15.0 | N/A | |
| Majority | 74 | 2.4 | +0.2 | ||
| Turnout | 3,103 | ||||
| Liberal gain from Labour | Swing | ||||
References
(1961 ←) | |
|---|---|
| Metropolitan boroughs |
|
| City corporations |
|