1966 Sale Municipal Borough Council election
| |||||||||||||||||||||||||||||||||||||||||||||
9 of 32 seats to Sale Municipal Borough Council 16 seats needed for a majority | |||||||||||||||||||||||||||||||||||||||||||||
|---|---|---|---|---|---|---|---|---|---|---|---|---|---|---|---|---|---|---|---|---|---|---|---|---|---|---|---|---|---|---|---|---|---|---|---|---|---|---|---|---|---|---|---|---|---|
| |||||||||||||||||||||||||||||||||||||||||||||
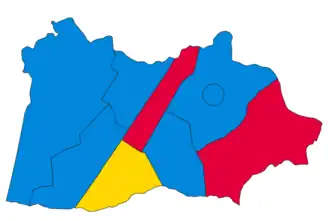 Map of results of 1966 election | |||||||||||||||||||||||||||||||||||||||||||||
| |||||||||||||||||||||||||||||||||||||||||||||
Elections to Sale Council were held on Thursday, 12 May 1966. One third of the councillors were up for election, with each successful candidate to serve a three-year term of office. The Conservative Party retained overall control of the council.[1][2]
Election result
| Party | Votes | Seats | Full Council | |||||||
| Conservative Party | 9,367 (52.3%) | 7 (77.8%) | 7 / 9
|
18 (56.3%) | 18 / 32
| |||||
| Labour Party | 4,024 (22.5%) | 2 (22.2%) | 2 / 9
|
8 (25.0%) | 8 / 32
| |||||
| Liberal Party | 4,516 (25.2%) | 1 (11.1%) | 1 / 9
|
6 (18.8%) | 6 / 32
| |||||
Full council
| 8 | 6 | 18 |
Aldermen
| 1 | 4 | 3 |
Councillors
| 7 | 2 | 15 |
Ward results
Brooklands
| Party | Candidate | Votes | % | ±% | |
|---|---|---|---|---|---|
| Liberal | P. W. Croft* | 882 | 50.6 | +18.6 | |
| Conservative | F. Hewitt | 862 | 49.4 | −10.6 | |
| Majority | 20 | 1.2 | |||
| Turnout | 1,744 | ||||
| Liberal hold | Swing | ||||
Mersey
| Party | Candidate | Votes | % | ±% | |
|---|---|---|---|---|---|
| Conservative | R. P. Bannister* | 875 | 47.6 | −4.6 | |
| Labour | A. Z. Keller | 681 | 37.1 | +7.1 | |
| Liberal | J. E. Thorner | 282 | 15.3 | −2.4 | |
| Majority | 194 | 10.5 | −11.8 | ||
| Turnout | 1,838 | ||||
| Conservative hold | Swing | ||||
St. Anne's
| Party | Candidate | Votes | % | ±% | |
|---|---|---|---|---|---|
| Conservative | S. C. Swann | 1,188 | 28.8 | ||
| Conservative | G. Thornton | 1,151 | 28.0 | ||
| Liberal | E. M. Parker | 903 | 21.9 | ||
| Liberal | J. B. Sullivan* | 876 | 21.3 | ||
| Majority | 248 | 6.1 | |||
| Turnout | 4,118 | ||||
| Conservative gain from Liberal | Swing | ||||
| Conservative hold | Swing | ||||
St. John's
| Party | Candidate | Votes | % | ±% | |
|---|---|---|---|---|---|
| Conservative | W. K. Tedham* | 1,027 | 56.4 | ||
| Liberal | J. Cooper | 794 | 43.6 | ||
| Majority | 233 | 12.8 | |||
| Turnout | 1,821 | ||||
| Conservative hold | Swing | ||||
St. Martin's
| Party | Candidate | Votes | % | ±% | |
|---|---|---|---|---|---|
| Conservative | R. L. Heath* | 1,860 | 61.1 | +12.9 | |
| Labour | A. Wilkinson | 1,182 | 38.9 | +8.6 | |
| Majority | 678 | 22.3 | +4.4 | ||
| Turnout | 3,042 | ||||
| Conservative hold | Swing | ||||
St. Mary's
| Party | Candidate | Votes | % | ±% | |
|---|---|---|---|---|---|
| Conservative | G. Russell* | 1,288 | 81.1 | +22.2 | |
| Labour | A. Mackie | 301 | 18.9 | +11.2 | |
| Majority | 987 | 62.1 | +36.6 | ||
| Turnout | 1,589 | ||||
| Conservative hold | Swing | ||||
St. Paul's
| Party | Candidate | Votes | % | ±% | |
|---|---|---|---|---|---|
| Labour | E. P. Mellor* | 674 | 55.4 | ||
| Conservative | B. Oldfield | 542 | 44.6 | ||
| Majority | 132 | 10.9 | |||
| Turnout | 1,216 | ||||
| Labour hold | Swing | ||||
Sale Moor
| Party | Candidate | Votes | % | ±% | |
|---|---|---|---|---|---|
| Labour | R. Harris | 1,186 | 46.7 | −5.9 | |
| Liberal | V. A. M. Flynn* | 779 | 30.7 | −16.7 | |
| Conservative | G. Yates | 574 | 22.6 | N/A | |
| Majority | 407 | 16.0 | +10.8 | ||
| Turnout | 2,539 | ||||
| Labour gain from Liberal | Swing | ||||
References
(1965 ←) | |
|---|---|
| City corporations |
|