1969 Hale Urban District Council election
| |||||||||||||||||||||||||||||||||||||||||||||
5 of 12 seats to Hale Urban District Council 6 seats needed for a majority | |||||||||||||||||||||||||||||||||||||||||||||
|---|---|---|---|---|---|---|---|---|---|---|---|---|---|---|---|---|---|---|---|---|---|---|---|---|---|---|---|---|---|---|---|---|---|---|---|---|---|---|---|---|---|---|---|---|---|
| |||||||||||||||||||||||||||||||||||||||||||||
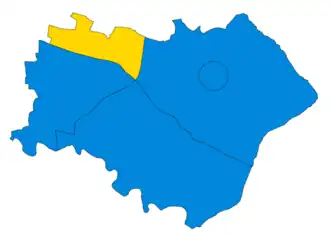 Map of results of 1969 election | |||||||||||||||||||||||||||||||||||||||||||||
| |||||||||||||||||||||||||||||||||||||||||||||
Elections to Hale Council were held on Saturday, 10 May 1969. One third of the councillors were up for election, with each successful candidate to serve a three-year term of office. The Conservative Party retained overall control of the council.[1][2]
Election result
| Party | Votes | Seats | Full Council | |||||||
| Conservative Party | 3,579 (53.7%) | 4 (80.0%) | 4 / 5
|
9 (75.0%) | 9 / 12
| |||||
| Liberal Party | 1,608 (24.1%) | 1 (20.0%) | 1 / 5
|
2 (16.7%) | 2 / 12
| |||||
| Residents | 1,482 (22.2%) | 0 (0.0%) | 0 / 5
|
1 (8.3%) | 1 / 12
| |||||
| 2 | 1 | 9 |
Ward results
Bollin
| Party | Candidate | Votes | % | ±% | |
|---|---|---|---|---|---|
| Conservative | R. A. Roberts | uncontested | |||
| Conservative hold | Swing | ||||
Central
| Party | Candidate | Votes | % | ±% | |
|---|---|---|---|---|---|
| Conservative | N. W. Barrett | 1,131 | 61.8 | −1.3 | |
| Liberal | A. G. Taylor | 699 | 38.2 | +1.3 | |
| Majority | 432 | 23.6 | −2.6 | ||
| Turnout | 1,830 | 54.8 | −0.5 | ||
| Conservative hold | Swing | ||||
North
| Party | Candidate | Votes | % | ±% | |
|---|---|---|---|---|---|
| Liberal | E. P. Atkin* | 909 | 53.9 | 0.0 | |
| Conservative | A. Knott | 779 | 46.1 | 0.0 | |
| Majority | 130 | 7.8 | 0.0 | ||
| Turnout | 1,688 | 57.8 | 0.0 | ||
| Liberal hold | Swing | ||||
Wellgreen
| Party | Candidate | Votes | % | ±% | |
|---|---|---|---|---|---|
| Conservative | W. G. Stewart | 836 | 51.2 | +6.5 | |
| Conservative | P. A. A. Pepper | 833 | 51.0 | +6.3 | |
| Residents | R. Hainsworth* | 774 | 47.4 | −7.9 | |
| Residents | H. James | 708 | 43.3 | −12.0 | |
| Majority | 59 | 3.6 | |||
| Turnout | 1,634 | 61.0 | +0.6 | ||
| Conservative gain from Residents | Swing | ||||
| Conservative gain from Residents | Swing | ||||