1970 Hale Urban District Council election
| |||||||||||||||||||||||||||||||||||||||||||||
4 of 12 seats to Hale Urban District Council 6 seats needed for a majority | |||||||||||||||||||||||||||||||||||||||||||||
|---|---|---|---|---|---|---|---|---|---|---|---|---|---|---|---|---|---|---|---|---|---|---|---|---|---|---|---|---|---|---|---|---|---|---|---|---|---|---|---|---|---|---|---|---|---|
| |||||||||||||||||||||||||||||||||||||||||||||
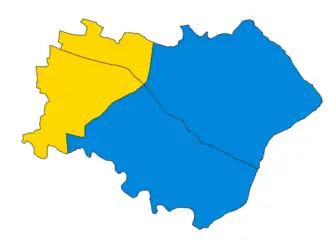 Map of results of 1970 election | |||||||||||||||||||||||||||||||||||||||||||||
| |||||||||||||||||||||||||||||||||||||||||||||
Elections to Hale Council were held on Saturday, 9 May 1970. One third of the councillors were up for election, with each successful candidate to serve a three-year term of office. The Conservative Party retained overall control of the council.[1][2]
Election result
| Party | Votes | Seats | Full Council | |||||||
| Conservative Party | 2,496 (46.8%) | 2 (50.0%) | 2 / 4
|
7 (58.3%) | 7 / 12
| |||||
| Liberal Party | 1,987 (37.2%) | 2 (50.0%) | 2 / 4
|
4 (33.3%) | 4 / 12
| |||||
| Residents | 856 (16.0%) | 0 (0.0%) | 0 / 4
|
1 (8.3%) | 1 / 12
| |||||
| 4 | 1 | 7 |
Ward results
Bollin
| Party | Candidate | Votes | % | ±% | |
|---|---|---|---|---|---|
| Conservative | J. S. Pickles* | uncontested | |||
| Conservative hold | Swing | ||||
Central
| Party | Candidate | Votes | % | ±% | |
|---|---|---|---|---|---|
| Liberal | A. G. Taylor | 1,034 | 54.2 | +16.0 | |
| Conservative | W. A. L. Sawyer* | 837 | 45.8 | −16.0 | |
| Majority | 161 | 8.4 | |||
| Turnout | 1,907 | 55.8 | −1.0 | ||
| Liberal gain from Conservative | Swing | ||||
North
| Party | Candidate | Votes | % | ±% | |
|---|---|---|---|---|---|
| Liberal | J. W. Parker | 953 | 56.0 | +2.1 | |
| Conservative | J. Jenner | 750 | 44.0 | −2.1 | |
| Majority | 203 | 12.0 | +4.2 | ||
| Turnout | 1,703 | 56.4 | −1.4 | ||
| Liberal gain from Conservative | Swing | ||||
Wellgreen
| Party | Candidate | Votes | % | ±% | |
|---|---|---|---|---|---|
| Conservative | P. A. A. Pepper* | 909 | 51.5 | +0.3 | |
| Residents | H. James | 856 | 48.5 | +1.1 | |
| Majority | 53 | 3.0 | −0.6 | ||
| Turnout | 1,765 | 62.0 | +1.0 | ||
| Conservative hold | Swing | ||||
References
| Unicameral area | |
|---|---|
| County councils (England) |
|
| County councils (Scotland) |
|
| County councils (Wales} |
|
| City corporations |
|
| County boroughs |
|
| |