1972 Grenadian general election
| |||||||||||||||||||||||||||||||
All 15 seats in the House of Representatives 8 seats needed for a majority | |||||||||||||||||||||||||||||||
|---|---|---|---|---|---|---|---|---|---|---|---|---|---|---|---|---|---|---|---|---|---|---|---|---|---|---|---|---|---|---|---|
| |||||||||||||||||||||||||||||||
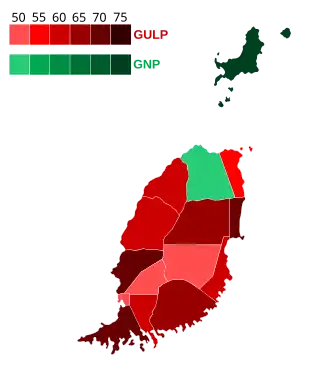 Results by constituency | |||||||||||||||||||||||||||||||
| |||||||||||||||||||||||||||||||

.jpg)
 |
|---|
| Administrative divisions (parishes) |
General elections were held in Grenada on 28 February 1972.[1] The result was a victory for the Grenada United Labour Party, which won 13 of the 15 seats. Voter turnout was 83.5%.[2]
Results
 | |||||
|---|---|---|---|---|---|
| Party | Votes | % | Seats | +/– | |
| Grenada United Labour Party | 20,158 | 58.87 | 13 | +6 | |
| Grenada National Party | 14,086 | 41.13 | 2 | –1 | |
| Total | 34,244 | 100.00 | 15 | +5 | |
| Valid votes | 34,244 | 98.75 | |||
| Invalid/blank votes | 435 | 1.25 | |||
| Total votes | 34,679 | 100.00 | |||
| Registered voters/turnout | 41,538 | 83.49 | |||
| Source: Caribbean Elections | |||||
References
- ^ Dieter Nohlen (2005) Elections in the Americas: A data handbook, Volume I, p307 ISBN 978-0-19-928357-6
- ^ Nohlen, p310