1977 West Midlands County Council election
| |||||||||||||||||||||||||||||
104 seats to the West Midlands County Council 52 seats needed for a majority | |||||||||||||||||||||||||||||
|---|---|---|---|---|---|---|---|---|---|---|---|---|---|---|---|---|---|---|---|---|---|---|---|---|---|---|---|---|---|
| Turnout | 37.1% | ||||||||||||||||||||||||||||
| |||||||||||||||||||||||||||||
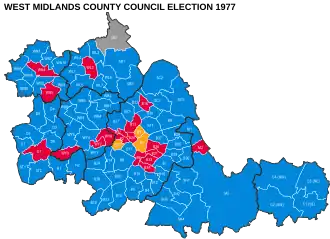 Map showing the results of the 1981 West Midlands County Council election by electoral division. | |||||||||||||||||||||||||||||
| |||||||||||||||||||||||||||||
Local elections to the West Midlands County Council, a Metropolitan County Council encompassing the West Midlands, were held on 5 May 1977.
The Conservatives gained control of the council for the first time, registering large swings and gaining 54 seats from the incumbent Labour administration.[1][2]
Results
| Party | Seats | Gains | Losses | Net gain/loss | Seats % | Votes % | Votes | +/− | |
|---|---|---|---|---|---|---|---|---|---|
| Conservative | 82 | 58.8% | 429,835 | ||||||
| Labour | 18 | 31.3% | 228,895 | ||||||
| Liberal | 3 | 4.2% | 30,850 | ||||||
| Independent | 1 | 0.7% | 5,207 | ||||||
| National Front | 0 | 3.7% | 27,055 | ||||||
| Other parties | 0 | 1.3% | 9,656 | ||||||
Council composition
After the election the composition of the council was:
| 82 | 18 | 3 | 1 |
| Conservative | Labour | Liberal | Ind |
Borough summary
References
- ^ "Local Elections Handbook 1977". Elections Centre. Colin Rallings and Michael Thrasher. Retrieved 18 February 2025.
- ^ ""Tory Glory!"". Birmingham Evening Mail. 6 May 1977. p. 1.
| Birmingham | |
|---|---|
| Coventry | |
| Dudley | |
| Sandwell | |
| Solihull | |
| Walsall | |
| Wolverhampton | |
| West Midlands County Council |
|
| Mayor | |
| |