1981 Cumbria County Council election
| |||||||||||||||||||||||||||||||||||||||||||||||||||||||||||
All 83 seats of Cumbria County Council 42 seats needed for a majority | |||||||||||||||||||||||||||||||||||||||||||||||||||||||||||
|---|---|---|---|---|---|---|---|---|---|---|---|---|---|---|---|---|---|---|---|---|---|---|---|---|---|---|---|---|---|---|---|---|---|---|---|---|---|---|---|---|---|---|---|---|---|---|---|---|---|---|---|---|---|---|---|---|---|---|---|
| |||||||||||||||||||||||||||||||||||||||||||||||||||||||||||
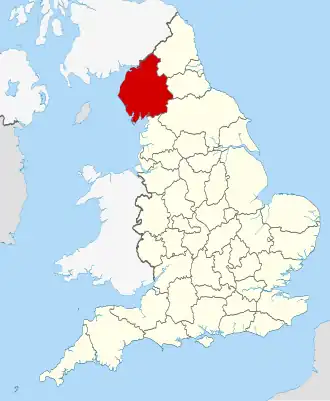 The County of Cumbria within England | |||||||||||||||||||||||||||||||||||||||||||||||||||||||||||
| |||||||||||||||||||||||||||||||||||||||||||||||||||||||||||
Elections to Cumbria County Council were held on 7 May 1981. This was on the same day as other UK county council elections. The council size was increased to 83 members following a boundary review.[2] The Labour Party gained control of the council from the Conservative Party.
Results
| Party | Seats | Gains | Losses | Net gain/loss | Seats % | Votes % | Votes | +/− | |
|---|---|---|---|---|---|---|---|---|---|
| Labour | 42 | 50.6 | 49.0 | 74,286 | |||||
| Conservative | 35 | 42.2 | 40.4 | 61,242 | |||||
| Liberal | 3 | 3.6 | 8.6 | 13,053 | |||||
| Independent | 3 | 3.6 | 1.5 | 2,242 | |||||
| Ecology | 0 | 0.0 | 0.5 | 683 | New | ||||
| PARA | 0 | 0.0 | 0.1 | 134 | New | ||||
| National Front | 0 | 0.0 | 0.0 | 59 | New | ||||
References
- ^ a b "Local Election Summaries 1981". The Elections Centre. Retrieved 15 October 2019.
- ^ The County of Cumbria (Electoral Arrangements) Order 1981
| County councils (England) |
|
|---|---|
| County councils (Wales) |
|
| Metropolitan counties |
|
| Unicameral area | |
| District councils (Northern Ireland) | |
| Sui generis |
|