1990 Austrian legislative election
| |||||||||||||||||||||||||||||||||||||||||||||||||||||||||||||||||
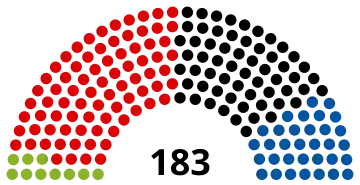
All 183 seats in the National Council 92 seats needed for a majority | |||||||||||||||||||||||||||||||||||||||||||||||||||||||||||||||||
|---|---|---|---|---|---|---|---|---|---|---|---|---|---|---|---|---|---|---|---|---|---|---|---|---|---|---|---|---|---|---|---|---|---|---|---|---|---|---|---|---|---|---|---|---|---|---|---|---|---|---|---|---|---|---|---|---|---|---|---|---|---|---|---|---|---|
| |||||||||||||||||||||||||||||||||||||||||||||||||||||||||||||||||

| |||||||||||||||||||||||||||||||||||||||||||||||||||||||||||||||||
| |||||||||||||||||||||||||||||||||||||||||||||||||||||||||||||||||
_(cropped).jpg)
.jpg)
.jpg)
.jpg)
| This article is part of a series on the |
| Politics of Austria |
|---|
 |
|
Wöginger • Babler • Kickl • Maurer • Meinl-Reisinger •
|
|
|
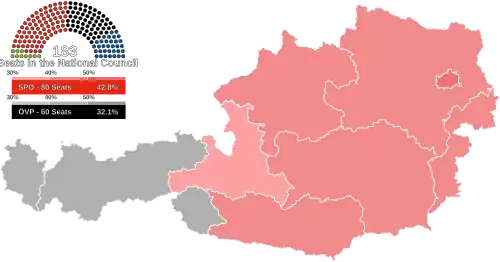
Parliamentary elections were held in Austria on 7 October 1990.[1] The Social Democratic Party won the most seats, and retained the grand coalition with the Austrian People's Party. Voter turnout was 86%.[2]
Results
 | |||||
|---|---|---|---|---|---|
| Party | Votes | % | Seats | +/– | |
| Socialist Party of Austria | 2,012,787 | 42.78 | 80 | 0 | |
| Austrian People's Party | 1,508,600 | 32.06 | 60 | –17 | |
| Freedom Party of Austria | 782,648 | 16.63 | 33 | +15 | |
| Green Alternative–Freda Meissner-Blau List | 225,084 | 4.78 | 10 | +2 | |
| United Greens of Austria | 92,277 | 1.96 | 0 | 0 | |
| Alliance of Welfare Beneficiaries | 35,833 | 0.76 | 0 | New | |
| Communist Party of Austria | 25,682 | 0.55 | 0 | 0 | |
| Christian Electoral Community | 9,263 | 0.20 | 0 | New | |
| Christian Democratic Party | 6,194 | 0.13 | 0 | New | |
| Grey Austrians' Election Platform | 3,996 | 0.08 | 0 | New | |
| Fritz Georg | 2,530 | 0.05 | 0 | New | |
| Total | 4,704,894 | 100.00 | 183 | 0 | |
| Valid votes | 4,704,894 | 97.03 | |||
| Invalid/blank votes | 143,847 | 2.97 | |||
| Total votes | 4,848,741 | 100.00 | |||
| Registered voters/turnout | 5,628,912 | 86.14 | |||
| Source: Nohlen & Stöver | |||||
Results by state
| State | SPÖ | ÖVP | FPÖ | GRÜNE | Others | ||||
|---|---|---|---|---|---|---|---|---|---|
| 49.9 | 35.4 | 11.1 | 2.5 | 1.1 | |||||
| 46.1 | 18.5 | 30.3 | 3.0 | 2.1 | |||||
| 42.5 | 39.1 | 12.2 | 3.3 | 2.9 | |||||
| 42.0 | 33.3 | 16.0 | 4.1 | 4.5 | |||||
| 37.8 | 32.1 | 20.5 | 7.3 | 2.2 | |||||
| 43.3 | 33.2 | 16.8 | 3.9 | 2.7 | |||||
| 30.5 | 40.7 | 17.1 | 6.3 | 5.3 | |||||
| 28.8 | 40.4 | 17.2 | 5.2 | 8.4 | |||||
| 50.7 | 21.1 | 15.7 | 7.6 | 4.9 | |||||
| 42.8 | 32.1 | 16.6 | 4.8 | 3.7 | |||||
| Source: Institute for Social Research and Consulting (SORA)[3] | |||||||||
References
- ^ Dieter Nohlen & Philip Stöver (2010) Elections in Europe: A data handbook, p196 ISBN 978-3-8329-5609-7
- ^ Nohlen & Stöver, p216
- ^ "National election results Austria 1919 - 2017 (OA edition)", Institute for Social Research and Consulting (SORA) (in German), Austrian Social Science Data Archive (AUSSDA), 2019-07-24, doi:10.11587/EQUDAL
| |||||||||||
| |||||||||||