1990 Saarland state election
| |||||||||||||||||||||||||||||||||||||||||
All 51 seats of the Landtag of Saarland 26 seats needed for a majority | |||||||||||||||||||||||||||||||||||||||||
|---|---|---|---|---|---|---|---|---|---|---|---|---|---|---|---|---|---|---|---|---|---|---|---|---|---|---|---|---|---|---|---|---|---|---|---|---|---|---|---|---|---|
| Turnout | 694,101 (83.2%) | ||||||||||||||||||||||||||||||||||||||||
| |||||||||||||||||||||||||||||||||||||||||
 | |||||||||||||||||||||||||||||||||||||||||
.jpg)
.jpg)
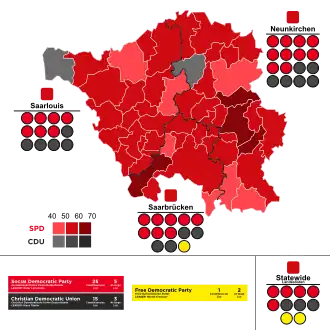
The 1990 Saarland state election was held on 28 January 1990 to elect the members of the Landtag of Saarland. The incumbent Social Democratic Party (SPD) government led by Minister-President Oskar Lafontaine was returned with an increased majority and continued in office.
Parties
The table below lists parties represented in the previous Landtag of Saarland.
| Name | Ideology | Leader(s) | 1985 result | |||
|---|---|---|---|---|---|---|
| Votes (%) | Seats | |||||
| SPD | Social Democratic Party of Germany Sozialdemokratische Partei Deutschlands |
Social democracy | Oskar Lafontaine | 49.2% | 26 / 51
| |
| CDU | Christian Democratic Union of Germany Christlich Demokratische Union Deutschlands |
Christian democracy | Klaus Töpfer | 37.3% | 20 / 51
| |
| FDP | Free Democratic Party Freie Demokratische Partei |
Classical liberalism | 10.0% | 5 / 51
| ||
Election result
| Party | Votes | % | +/- | Seats | +/- | Seats % | |
|---|---|---|---|---|---|---|---|
| Social Democratic Party (SPD) | 377,502 | 54.4 | 30 | 58.8 | |||
| Christian Democratic Union (CDU) | 231,983 | 33.4 | 18 | 35.3 | |||
| Free Democratic Party (FDP) | 39,113 | 5.6 | 3 | 5.9 | |||
| The Republicans (REP) | 23,263 | 3.4 | 0 | ±0 | 0 | ||
| Alliance 90/The Greens (Grüne) | 18,380 | 2.6 | 0 | ±0 | 0 | ||
| Others | 3,860 | 0.6 | 0 | ±0 | 0 | ||
| Total | 694,101 | 100.0 | 51 | ±0 | |||
| Voter turnout | 83.2 | ||||||
Sources
| Landtag of Saarland | |
|---|---|
| Municipal | |
| Referendums | |
| |