2003 Tewkesbury Borough Council election
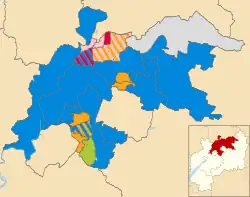
The 2003 Tewkesbury Borough Council election took place on 1 May 2003 to elect members of Tewkesbury Borough Council in England.[1] This was on the same day as other local elections. The whole council was up for election on new ward boundaries.[2]
Election results
| Party | Seats | Gains | Losses | Net gain/loss | Seats % | Votes % | Votes | +/− | |
|---|---|---|---|---|---|---|---|---|---|
| Conservative | 17 | 44.7 | 43.0 | 10,000 | |||||
| Liberal Democrats | 10 | 26.3 | 28.1 | 6,535 | |||||
| Labour | 3 | 7.9 | 11.0 | 2,551 | |||||
| TTI | 4 | 10.5 | 7.5 | 1,756 | |||||
| Independent | 1 | 2.6 | 6.1 | 1,422 | |||||
| Brockworth Residents Group | 3 | 7.9 | 3.6 | 830 | |||||
| Green | 0 | 0.0 | 0.8 | 175 | |||||
Ward results
Ashchurch with Walton Cardiff
| Party | Candidate | Votes | % | ±% | |
|---|---|---|---|---|---|
| Liberal Democrats | Caitriona Clucas | 305 | 39.9 | ||
| Tewkesbury Independents | Philip Workman | 274 | 35.9 | ||
| Liberal Democrats | John Clucas | 268 | 35.1 | ||
| Tewkesbury Independents | Ronald Hopkins | 219 | 28.7 | ||
| Conservative | Adam Tugwell | 204 | 26.7 | ||
| Conservative | Mary Kirby | 173 | 22.6 | ||
| Majority | 6 | 0.8 | |||
| Turnout | 764 | 34.0 | |||
| Liberal Democrats win (new seat) | |||||
| Tewkesbury Independents win (new seat) | |||||
Badgeworth
| Party | Candidate | Votes | % | ±% | |
|---|---|---|---|---|---|
| Conservative | Robert Vines* | 395 | 66.9 | ||
| Liberal Democrats | Janice Ledeux | 195 | 33.1 | ||
| Majority | 200 | 33.8 | |||
| Turnout | 590 | 33.0 | |||
| Conservative win (new seat) | |||||
Brockworth
| Party | Candidate | Votes | % | ±% | |
|---|---|---|---|---|---|
| Brockworth Residents Group | Godfrey Browning | 830 | 44.2 | ||
| Brockworth Residents Group | Sean Connors* | 754 | 40.2 | ||
| Brockworth Residents Group | Colin Gomersall | 694 | 37.0 | ||
| Labour | Mark Hendry* | 640 | 34.1 | ||
| Labour | Louise Gerrard* | 555 | 29.6 | ||
| Labour | Susan Dunn | 515 | 27.4 | ||
| Conservative | David Hunt | 359 | 19.1 | ||
| Conservative | Ronald Chapman | 293 | 15.6 | ||
| Conservative | Ian Barnes | 248 | 13.2 | ||
| Green | Robert Rendell | 175 | 9.3 | ||
| Majority | 54 | 2.9 | |||
| Turnout | 1,877 | 37.6 | |||
| Brockworth Residents Group win (new seat) | |||||
| Brockworth Residents Group win (new seat) | |||||
| Brockworth Residents Group win (new seat) | |||||
Churchdown Brookfield
| Party | Candidate | Votes | % | ±% | |
|---|---|---|---|---|---|
| Liberal Democrats | Richard Smith* | 840 | 54.2 | ||
| Conservative | Brian Jones* | 778 | 50.2 | ||
| Liberal Democrats | Anthony Stokes | 725 | 46.8 | ||
| Conservative | Greg Ching | 610 | 39.4 | ||
| Majority | 53 | 3.4 | |||
| Turnout | 1,550 | 46.0 | |||
| Liberal Democrats win (new seat) | |||||
| Conservative win (new seat) | |||||
Churchdown St John's
| Party | Candidate | Votes | % | ±% | |
|---|---|---|---|---|---|
| Liberal Democrats | Hazel Finch | 749 | 44.3 | ||
| Liberal Democrats | Pearl Stokes* | 749 | 44.3 | ||
| Liberal Democrats | Audrey Ricks | 592 | 35.1 | ||
| Conservative | Neville Nutting | 590 | 34.9 | ||
| Conservative | Belinda Hope | 517 | 30.6 | ||
| Conservative | Angela Ockelton | 474 | 28.1 | ||
| Labour | Kelvin Tustin* | 381 | 22.6 | ||
| Labour | Keir Dhillon* | 364 | 21.6 | ||
| Labour | Ann Lightfoot | 278 | 16.5 | ||
| Majority | 2 | 0.2 | |||
| Turnout | 1,689 | 33.0 | |||
| Liberal Democrats win (new seat) | |||||
| Liberal Democrats win (new seat) | |||||
| Liberal Democrats win (new seat) | |||||
Cleeve Grange
| Party | Candidate | Votes | % | ±% | |
|---|---|---|---|---|---|
| Liberal Democrats | Susan Hillier-Richardson | 441 | 62.2 | ||
| Conservative | Mark Calway* | 224 | 31.6 | ||
| Labour | Peter Lightfoot | 44 | 6.2 | ||
| Majority | 217 | 30.6 | |||
| Turnout | 709 | 44.0 | |||
| Liberal Democrats win (new seat) | |||||
Cleeve Hill
| Party | Candidate | Votes | % | ±% | |
|---|---|---|---|---|---|
| Conservative | Kenneth Leech | 763 | 63.7 | ||
| Conservative | Florence Ogden* | 630 | 52.6 | ||
| Liberal Democrats | Colin Tudor | 571 | 47.7 | ||
| Majority | 59 | 4.9 | |||
| Turnout | 1,198 | 44.0 | |||
| Conservative win (new seat) | |||||
| Conservative win (new seat) | |||||
Cleeve St Michael's
| Party | Candidate | Votes | % | ±% | |
|---|---|---|---|---|---|
| Conservative | Robert East* | 625 | 65.9 | ||
| Conservative | Michael Beresford* | 530 | 55.9 | ||
| Liberal Democrats | John Danes | 300 | 31.6 | ||
| Liberal Democrats | Michael Dray | 187 | 19.7 | ||
| Independent | Eric Foster | 122 | 12.9 | ||
| Majority | 230 | 24.3 | |||
| Turnout | 948 | 32.0 | |||
| Conservative win (new seat) | |||||
| Conservative win (new seat) | |||||
Cleeve West
| Party | Candidate | Votes | % | ±% | |
|---|---|---|---|---|---|
| Liberal Democrats | Peter Richmond | 706 | 64.4 | ||
| Liberal Democrats | Anthony MacKinnon | 683 | 62.3 | ||
| Conservative | Clive Lawrence | 328 | 29.9 | ||
| Conservative | Michael Wright | 239 | 21.8 | ||
| Labour | Robert Trafford | 85 | 7.8 | ||
| Majority | 355 | 32.4 | |||
| Turnout | 1,096 | 33.0 | |||
| Liberal Democrats win (new seat) | |||||
| Liberal Democrats win (new seat) | |||||
Coombe Hill
| Party | Candidate | Votes | % | ±% | |
|---|---|---|---|---|---|
| Conservative | Mark Williams* | 690 | 58.1 | ||
| Conservative | Bruce Stephens* | 649 | 54.7 | ||
| Liberal Democrats | Sarah Olney | 320 | 27.0 | ||
| Independent | Lennard Attard | 298 | 25.1 | ||
| Majority | 329 | 27.7 | |||
| Turnout | 1,187 | 33.0 | |||
| Conservative win (new seat) | |||||
| Conservative win (new seat) | |||||
Highnam with Haw Bridge
| Party | Candidate | Votes | % | ±% | |
|---|---|---|---|---|---|
| Conservative | Derek Davies | 904 | 56.7 | ||
| Conservative | Philip Awford | 861 | 54.0 | ||
| Liberal Democrats | Patricia Duggan | 623 | 39.1 | ||
| Liberal Democrats | Helen Hughes | 608 | 38.1 | ||
| Majority | 238 | 14.9 | |||
| Turnout | 1,595 | 44.0 | |||
| Conservative win (new seat) | |||||
| Conservative win (new seat) | |||||
Hucclecote
| Party | Candidate | Votes | % | ±% | |
|---|---|---|---|---|---|
| Liberal Democrats | Peter Brazil | 309 | 60.8 | ||
| Labour | Peter Sharples | 116 | 22.8 | ||
| Conservative | Gary Phipps | 83 | 16.3 | ||
| Majority | 193 | 38.0 | |||
| Turnout | 508 | 42.0 | |||
| Liberal Democrats win (new seat) | |||||
Innsworth with Down Hatherley
| Party | Candidate | Votes | % | ±% | |
|---|---|---|---|---|---|
| Conservative | Paul Ockelton* | 386 | 51.9 | ||
| Liberal Democrats | William Whelan | 358 | 48.1 | ||
| Majority | 28 | 3.8 | |||
| Turnout | 744 | 43.0 | |||
| Conservative win (new seat) | |||||
Isbourne
| Party | Candidate | Votes | % | ±% | |
|---|---|---|---|---|---|
| Independent | John Evetts* | 631 | 70.6 | ||
| Conservative | Judith Gilder | 263 | 29.4 | ||
| Majority | 368 | 41.2 | |||
| Turnout | 894 | 54.1 | |||
| Independent win (new seat) | |||||
Northway
| Party | Candidate | Votes | % | ±% | |
|---|---|---|---|---|---|
| Labour | Margaret Levett* | 380 | 54.3 | ||
| Labour | Patrick McCarthy | 253 | 36.1 | ||
| Conservative | Mary Harper* | 240 | 34.3 | ||
| Conservative | Stuart Shepherd | 191 | 27.3 | ||
| Independent | Henry Tychmanowicz | 179 | 25.6 | ||
| Majority | 13 | 1.8 | |||
| Turnout | 700 | 19.8 | |||
| Labour win (new seat) | |||||
| Labour win (new seat) | |||||
Oxenton Hill
| Party | Candidate | Votes | % | ±% | |
|---|---|---|---|---|---|
| Conservative | Allen Keyte | 497 | 88.6 | ||
| Liberal Democrats | Alastair Mason | 64 | 11.4 | ||
| Majority | 433 | 77.2 | |||
| Turnout | 561 | 44.8 | |||
| Conservative win (new seat) | |||||
Shurdington
| Party | Candidate | Votes | % | ±% | |
|---|---|---|---|---|---|
| Conservative | Philip Surman | 379 | 72.5 | ||
| Labour | Donald McLellan | 144 | 27.5 | ||
| Majority | 235 | 45.0 | |||
| Turnout | 523 | 34.0 | |||
| Conservative win (new seat) | |||||
Tewkesbury Newtown
| Party | Candidate | Votes | % | ±% | |
|---|---|---|---|---|---|
| Tewkesbury Independents | John McCloy* | 480 | 78.6 | ||
| Conservative | Graham Dawson | 131 | 21.4 | ||
| Majority | 349 | 57.2 | |||
| Turnout | 611 | 39.0 | |||
| Tewkesbury Independents win (new seat) | |||||
Tewkesbury Prior's Park
| Party | Candidate | Votes | % | ±% | |
|---|---|---|---|---|---|
| Labour | Joan Sklenar* | 327 | 38.4 | ||
| Conservative | Brian Calway | 298 | 35.0 | ||
| Conservative | Peter Aldridge | 272 | 32.0 | ||
| Labour | Joan Collip | 222 | 26.1 | ||
| Independent | Robert Devine | 192 | 22.6 | ||
| Tewkesbury Independents | Christine Donald | 80 | 9.4 | ||
| Liberal Democrats | Brenda Dick | 73 | 8.6 | ||
| Majority | 26 | 3.0 | |||
| Turnout | 851 | 25.0 | |||
| Labour win (new seat) | |||||
| Conservative win (new seat) | |||||
Tewkesbury Town with Mitton
| Party | Candidate | Votes | % | ±% | |
|---|---|---|---|---|---|
| Tewkesbury Independents | Michael Sztymiak* | 776 | 65.2 | ||
| Tewkesbury Independents | Barbara Cromwell* | 679 | 57.1 | ||
| Conservative | Margaret White | 261 | 21.9 | ||
| Liberal Democrats | Gerald Portman | 220 | 18.5 | ||
| Conservative | Haydn Pearl | 213 | 17.9 | ||
| Majority | 418 | 35.2 | |||
| Turnout | 1,190 | 35.4 | |||
| Tewkesbury Independents win (new seat) | |||||
| Tewkesbury Independents win (new seat) | |||||
Twyning
| Party | Candidate | Votes | % | ±% | |
|---|---|---|---|---|---|
| Conservative | Gordon Shurmer* | 362 | 63.7 | ||
| Tewkesbury Independents | Robert Venables | 146 | 25.7 | ||
| Labour | David Playdon | 60 | 10.6 | ||
| Majority | 216 | 38.0 | |||
| Turnout | 568 | 41.0 | |||
| Conservative win (new seat) | |||||
Winchcombe
| Party | Candidate | Votes | % | ±% | |
|---|---|---|---|---|---|
| Conservative | Ronald Allen* | 1,240 | 63.8 | ||
| Conservative | Janet Day* | 1,172 | 60.3 | ||
| Conservative | James Mason* | 1,117 | 57.5 | ||
| Liberal Democrats | Kevin Guyll | 461 | 23.7 | ||
| Labour | Margaret Keir | 374 | 19.2 | ||
| Labour | Susan Sturgeon | 348 | 17.9 | ||
| Labour | John Hurley | 332 | 17.1 | ||
| Majority | 656 | 33.8 | |||
| Turnout | 1,943 | 39.0 | |||
| Conservative win (new seat) | |||||
| Conservative win (new seat) | |||||
| Conservative win (new seat) | |||||
References
- ^ "Tewkesbury Borough Council Election Results 1973-2011" (PDF). Colin Rallings and Michael Thrasher. Retrieved 2 June 2025.
- ^ "Final recommendations on the future electoral arrangements for Tewkesbury in Gloucestershire". CLGBCE. Retrieved 2 June 2025.