2004 Offaly County Council election|
|
|
|
|
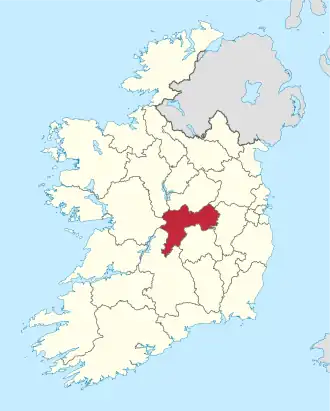 Map showing the area of Offaly County Council |
|
|
Council control after election
TBD
| |
An election to Offaly County Council took place on 11 June 2004 as part of that year's Irish local elections. 21 councillors were elected from four local electoral areas (LEAs) for a five-year term of office on the electoral system of proportional representation by means of the single transferable vote (PR-STV).
Results by party
Results by local electoral area
Birr
Birr - 5 seats
| Party |
Candidate |
FPv% |
Count[1]
|
| 1 |
2 |
3 |
4 |
5 |
6 |
7
|
|
|
Fianna Fáil
|
Peter Ormond*
|
13.82
|
1,067
|
1,116
|
1,218
|
1,271
|
1,294
|
|
|
|
|
Fine Gael
|
Percy Clendennen*
|
12.10
|
934
|
1,001
|
1,142
|
1,244
|
1,376
|
|
|
|
|
Independent
|
John Carroll
|
12.09
|
933
|
979
|
1,004
|
1,074
|
1,156
|
1,332
|
|
|
|
Independent
|
Tony McLoughlin
|
11.18
|
863
|
898
|
919
|
982
|
1,148
|
1,270
|
1,289
|
|
|
Fine Gael
|
Tom Rigney*
|
10.53
|
813
|
818
|
863
|
886
|
986
|
1,039
|
1,104
|
|
|
Fianna Fáil
|
Sinead Moylan-Ryan*
|
10.48
|
809
|
859
|
860
|
904
|
922
|
1,175
|
1,180
|
|
|
Fianna Fáil
|
William Loughlane
|
7.72
|
596
|
652
|
669
|
750
|
760
|
|
|
|
|
Fine Gael
|
Denis Sheils
|
6.21
|
479
|
491
|
530
|
558
|
|
|
|
|
|
Fine Gael
|
Billy Feighery
|
5.67
|
438
|
456
|
489
|
|
|
|
|
|
|
Progressive Democrats
|
Liam Egan
|
5.61
|
433
|
438
|
|
|
|
|
|
|
|
Fianna Fáil
|
Jimmy O'Brien
|
4.59
|
354
|
|
|
|
|
|
|
| Electorate: 11,941 Valid: 7,719 (64.64%) Spoilt: 126 Quota: 1,287 Turnout: 7,845 (65.70%)
|
Edenderry
Edenderry - 5 seats
| Party |
Candidate |
FPv% |
Count[2]
|
| 1 |
2 |
3 |
4 |
5 |
6 |
7 |
8
|
|
|
Fianna Fáil
|
Noel Bourke*
|
25.65
|
1,819
|
|
|
|
|
|
|
|
|
|
Fianna Fáil
|
Ger Killally*
|
17.44
|
1,237
|
|
|
|
|
|
|
|
|
|
Fine Gael
|
Geraldine McGarrigle
|
8.72
|
618
|
644
|
650
|
657
|
699
|
782
|
885
|
925
|
|
|
Fine Gael
|
John Foran*
|
7.47
|
530
|
610
|
620
|
624
|
695
|
823
|
993
|
1,038
|
|
|
Progressive Democrats
|
Eddie Fitzpatrick
|
7.09
|
503
|
520
|
616
|
617
|
692
|
878
|
901
|
1,092
|
|
|
Fine Gael
|
Liam Hogan
|
6.91
|
490
|
595
|
597
|
604
|
613
|
641
|
|
|
|
|
Progressive Democrats
|
Fergus McDonnell
|
6.28
|
445
|
624
|
650
|
657
|
692
|
706
|
893
|
947
|
|
|
Fine Gael
|
Jack Deegan
|
6.91
|
440
|
450
|
514
|
515
|
600
|
|
|
|
|
|
Independent
|
Frank Weir*
|
6.09
|
432
|
463
|
502
|
506
|
|
|
|
|
|
|
Fianna Fáil
|
Tom Nolan*
|
4.37
|
310
|
491
|
509
|
533
|
619
|
672
|
694
|
|
|
|
Progressive Democrats
|
Sam Gee
|
3.77
|
267
|
275
|
|
|
|
|
|
|
| Electorate: 12,817 Valid: 7,091 (55.32%) Spoilt: 174 Quota: 1,182 Turnout: 7,265 (56.68%)
|
Ferbane
Tullamore
Tullamore - 7 seats
| Party |
Candidate |
FPv% |
Count[4]
|
| 1 |
2 |
3 |
4 |
5 |
6 |
7 |
8 |
9 |
10 |
11 |
12 |
13
|
|
|
Fine Gael
|
Tommy McKeigue*
|
13.01
|
1,502
|
|
|
|
|
|
|
|
|
|
|
|
|
|
|
Independent
|
Dervill Dolan*
|
12.99
|
1,500
|
|
|
|
|
|
|
|
|
|
|
|
|
|
|
Independent
|
Molly Buckley*
|
11.38
|
1,314
|
1,324
|
1,327
|
1,342
|
1,352
|
1,380
|
1,452
|
|
|
|
|
|
|
|
|
Fianna Fáil
|
Barry Cowen*
|
10.13
|
1,169
|
1,172
|
1,188
|
1,225
|
1,245
|
1,249
|
1,259
|
1,275
|
1,304
|
1,321
|
1,485
|
|
|
|
|
Independent
|
Johnny Butterfield
|
8.76
|
1,011
|
1,017
|
1,019
|
1,027
|
1,034
|
1,054
|
1,078
|
1,090
|
1,134
|
1,182
|
1,209
|
1,286
|
1,371
|
|
|
Fine Gael
|
Michael Fox*
|
6.14
|
709
|
722
|
723
|
758
|
759
|
826
|
841
|
850
|
939
|
961
|
1,007
|
1,090
|
1,134
|
|
|
Fianna Fáil
|
Danny Owens
|
6.07
|
701
|
703
|
704
|
704
|
704
|
706
|
709
|
712
|
752
|
772
|
826
|
1,031
|
1,087
|
|
|
Independent
|
Frank Moran
|
5.60
|
646
|
647
|
669
|
693
|
723
|
724
|
729
|
761
|
767
|
796
|
807
|
821
|
|
|
|
Fianna Fáil
|
Paddy Rowland
|
5.15
|
594
|
597
|
598
|
602
|
602
|
616
|
620
|
624
|
637
|
653
|
719
|
|
|
|
|
Labour
|
Seán O'Brien*
|
4.58
|
529
|
535
|
536
|
537
|
542
|
554
|
570
|
664
|
688
|
726
|
781
|
889
|
948
|
|
|
Fianna Fáil
|
Brian Digan
|
3.89
|
449
|
452
|
453
|
454
|
455
|
460
|
464
|
472
|
482
|
503
|
|
|
|
|
|
Progressive Democrats
|
Breda Treacy
|
2.62
|
303
|
305
|
306
|
308
|
310
|
313
|
330
|
331
|
|
|
|
|
|
|
|
Sinn Féin
|
Seamus Walsh
|
2.06
|
238
|
239
|
239
|
239
|
322
|
324
|
336
|
346
|
361
|
|
|
|
|
|
|
Green
|
Alison Badrian
|
1.69
|
195
|
196
|
196
|
197
|
197
|
205
|
|
|
|
|
|
|
|
|
|
Labour
|
Peter Greville
|
1.63
|
188
|
189
|
191
|
193
|
199
|
207
|
214
|
|
|
|
|
|
|
|
|
Sinn Féin
|
Oliver O'Connor
|
1.47
|
170
|
170
|
173
|
176
|
|
|
|
|
|
|
|
|
|
|
|
Fine Gael
|
Kevin Doheny
|
1.46
|
168
|
173
|
173
|
185
|
185
|
|
|
|
|
|
|
|
|
|
|
Fine Gael
|
Noel Reynolds
|
1.36
|
157
|
159
|
162
|
|
|
|
|
|
|
|
|
|
|
| Electorate: 19,001 Valid: 11,543 (60.75%) Spoilt: 201 Quota: 1,443 Turnout: 11,744 (61.81%)
|
References