2008 Washington Statewide Executive Offices elections
Majority party
Minority party
Party
Democratic
Republican
Last election
6
3
Seats won
7
2
Seat change
Percentage
57.12%
42.88%
Swing
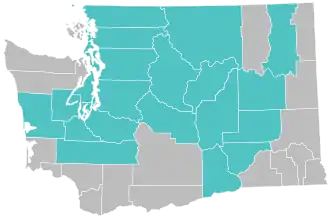
Washington has 9 Executive seats, all elected at large. In 2008, all 9 positions were up for reelection. As of 2025, this was the last set of statewide elections in Washington in which any Republicans won by double digits.
Offices and Candidates
Governor
Incumbent Democratic governor Christine Gregoire ran for re-election, defeating Republican nominee Dino Rossi . In contrast to the previous election , where Gregoire narrowly defeated Rossi by only 129 votes, Gregoire won by 6.5%.
2008 Washington gubernatorial election[ 1]
Primary election
Party
Candidate
Votes
%
Democratic
Christine Gregoire
696,306
48.27
Republican
Dino Rossi
668,571
46.35
Republican
John W. Aiken, Jr.
21,564
1.49
Democratic
Christian Joubert
16,646
1.15
Independent
James White
10,884
0.75
Green
Duff Badgley
9,702
0.67
Nonpartisan
Christopher Tudor
5,600
0.39
Reform
Will Baker
5,201
0.36
Republican
Javier O. Lopez
4,981
0.35
Nonpartisan
Mohammad Hasan Said
3,002
0.21
Total votes
1,442,457
100.00
General election
Democratic Christine Gregoire (incumbent) 1,598,738
53.24
Republican
Dino Rossi
1,404,124
46.76
Total votes
3,002,862
100.00
Democratic hold
Lt. Governor
2008 Washington lieutenant gubernatorial election
County results Congressional district results Owen : 50–60% 60–70% 70–80%McCraw : 50–60%
Brad Owen, who has held this position since 1996, ran for re-election to a fourth term. He defeated Republican nominee Marcia McCraw in a landslide, winning over 60% of the vote.
Blanket primary results by county 30–40%
40–50%
50–60%
60–70%
2008 Washington lieutenant gubernatorial election
Primary election
Party
Candidate
Votes
%
Democratic
Brad Owen (incumbent)
706,641
52.08
Republican
Marcia McCraw
347,551
25.62
Republican
Jim Wiest
193,752
14.28
Democratic
Randel Bell
53,694
4.02
Constitution
Arlene A. Peck
48,887
3.60
Total votes
1,335,908
100.00
General election
Democratic Brad Owen (incumbent) 1,718,033
60.80
Republican
Marcia McCraw
1,107,634
39.20
Total votes
2,825,667
100.00
Democratic hold
Secretary of State
2008 Washington secretary of state election
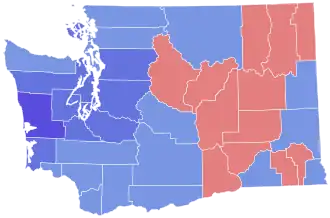
County results Congressional district results Reed: 50–60% 60–70% 70–80%Osgood: 50–60%
Sam Reed , who held this position since 2001, was re-elected to a third and final term, defeating Democrat Jason Osgood. As of 2025, this is the last time a Republican won the Secretary of State position by over 10%.
Blanket primary results by county 40–50%
50–60%
60–70%
70–80%
2012 Washington Secretary of State election
Primary election
Party
Candidate
Votes
%
Republican
Sam Reed
816,171
59.40
Democratic
Jason Osgood
446,222
32.48
Constitution
Marilyn Montgomery
88,728
6.46
Independent
Mark Greene
22,800
1.66
Total votes
1,330,036
100.00
General election
Republican Sam Reed (incumbent) 1,644,587
58.33
Democratic
Jason Osgood
1,175,086
41.67
Invalid or blank votes
Total votes
2,819,673
100.00
Turnout
Republican hold
State Treasurer
2008 Washington State Treasurer election
County results Congressional district results McIntire : 50–60% 60–70% 70–80%Martin : 50–60% 60–70%
Incumbent State Treasurer Mike Murphy (D) retired. Democratic State Representative James McIntire and Republican Allan Martin advanced to the general election, where McIntire narrowly won the open seat.
Blanket primary results by county 30–40%
40–50%
50–60%
60–70%
2008 Washington State Treasurer election
Primary election
Party
Candidate
Votes
%
Republican
Allan Martin
613,595
45.33
Democratic
James McIntire
533,443
39.41
Democratic
ChangMook Sohn
206,457
15.25
Total votes
1,353,495
100.00
General election
Democratic Jim McIntire 1,420,022
51.08
Republican
Allen Martin
1,360,063
48.92
Invalid or blank votes
Total votes
2,780,085
100.00
Turnout
Democratic hold
State Auditor
2008 Washington State Auditor election
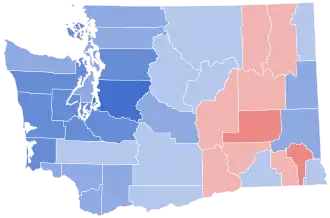
County results Congressional district results Sonntag : 50–60% 60–70% 70–80% 80–90%McEntee : 50–60%
Incumbent State Auditor Brian Sonntag , who has held this position since 1993, ran for re-election to a fifth term. Sonntag defeated Republican Richard "Dick" McEntee with over 63% of the vote. As of 2022, this is the last election where the Democratic candidate for State Auditor received over 60% of the vote.
Blanket primary results by county 40–50%
50–60%
60–70%
70–80%
Attorney general
2008 Washington Attorney General election
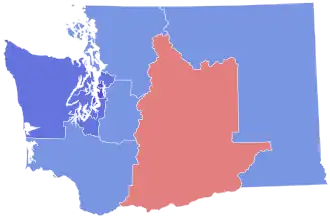
County results Congressional district results McKenna : 50–60% 60–70% 70–80%Ladenburg : 50–60% 60–70%
Incumbent Republican Attorney General Rob McKenna ran for re-election, facing Pierce County Executive John Ladenburg , a Democrat, in the general election. McKenna won re-election in a landslide, winning by almost 20 points and carrying all but two counties. As of 2025, this is the last time a Republican was elected Washington Attorney General.
Polling
General election
Poll source
Date(s)
Sample
Marginof error
Rob
John
Undecided
SurveyUSA [ 2] October 30 – November 2, 2008
663 (LV)
± 3.8%
59%
36%
6%
SurveyUSA [ 3] October 26–27, 2008
630 (LV)
± 3.9%
57%
36%
7%
SurveyUSA [ 4] October 12–13, 2008
544 (LV)
± 4.3%
54%
38%
8%
SurveyUSA [ 5] September 21–22, 2008
682 (LV)
± 3.8%
53%
39%
8%
SurveyUSA [ 6] September 5–7, 2008
658 (LV)
± 3.9%
55%
40%
5%
SurveyUSA [ 7] August 11–12, 2008
718 (LV)
± 3.7%
51%
43%
6%
SurveyUSA [ 8] July 13–15, 2008
666 (LV)
± 3.9%
49%
41%
10%
SurveyUSA [ 9] June 7–9, 2008
637 (LV)
± 4.0%
49%
42%
9%
Blanket primary results by county
2008 Washington Attorney General election
Primary election
Party
Candidate
Votes
%
Republican
Rob McKenna (incumbent)
783,240
56.98
Democratic
John Ladenburg
591,254
43.02
Total votes
1,374,494
100.00
General election
Republican Rob McKenna (incumbent) 1,689,764
59.46
Democratic
John Ladenburg
1,152,174
40.54
Invalid or blank votes
Total votes
2,841,938
100.00
Turnout
Republican hold
Commissioner of Public Lands
2008 Washington Public Lands Commissioner election
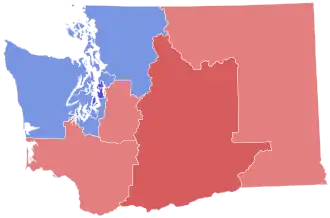
County results Congressional district results Goldmark : 50–60% 60–70% 70–80%Sutherland : 50–60% 60–70% 70–80%
Incumbent Doug Sutherland (R), who had first been elected in 2000, ran for re-election against rancher Peter J. Goldmark in a highly contested race. Despite polls before the election showing Sutherland leading, on election day Goldmark narrowly defeated Sutherland.
Polling
General election
Poll source
Date(s)
Sample
Marginof error
Doug
Peter
Undecided
SurveyUSA [ 2] October 30 – November 2, 2008
663 (LV)
± 3.9%
48%
42%
10%
SurveyUSA [ 3] October 26–27, 2008
630 (LV)
± 4.0%
45%
43%
12%
SurveyUSA [ 10] October 12–13, 2008
544 (LV)
± 4.3%
47%
38%
15%
Blanket primary results by county
2008 Washington Commissioner of Public Lands election
Primary election
Party
Candidate
Votes
%
Republican
Doug Sutherland (incumbent)
691,145
51.13
Democratic
Peter J. Goldmark
660,714
48.87
Total votes
1,351,859
100.00
General election
Democratic Peter J. Goldmark 1,416,904
50.55
Republican
Doug Sutherland (incumbent)
1,385,903
49.45
Invalid or blank votes
Total votes
2,802,807
100.00
Turnout
Democratic gain from Republican
Superintendent of Public Instruction
2008 Washington Superintendent of Public Instruction election
County results Congressional district results Dorn: 50–60%Bergeson: 50–60%
Incumbent Democratic Superintendent of Public Instruction Terry Bergeson ran for re-election to a third term. She was defeated by Randy Dorn . The superintendent is the only nonpartisan statewide election.
Polling
General election
Poll source
Date(s)
Sample
Marginof error
Terry
Randy
Undecided
SurveyUSA [ 2] October 30 – November 2, 2008
663 (LV)
± 3.9%
37%
45%
18%
SurveyUSA [ 3] October 26–27, 2008
630 (LV)
± 4.0%
38%
43%
19%
SurveyUSA [ 11] October 12–13, 2008
544 (LV)
± 4.3%
31%
43%
26%
SurveyUSA [ 12] September 21–22, 2008
682 (LV)
± 3.8%
35%
40%
25%
SurveyUSA [ 13] September 5–7, 2008
658 (LV)
± 3.9%
36%
41%
23%
SurveyUSA [ 14] August 11–12, 2008
718 (LV)
± 3.7%
32%
43%
25%
SurveyUSA [ 15] July 13–15, 2008
666 (LV)
± 3.9%
34%
32%
35%
Blanket primary results by county
2008 Washington Superintendent of Public Instruction election
Primary election
Party
Candidate
Votes
%
Nonpartisan
Terry Bergeson (incumbent)
477,130
39.31
Nonpartisan
Randy Dorn
414,313
34.13
Nonpartisan
Don Hansler
108,984
8.98
Nonpartisan
John P. Blair
90,508
7.46
Nonpartisan
Enid Duncan
78,983
6.51
Nonpartisan
David Blomstrom
43,984
3.62
Total votes
1,213,902
100.00
General election
Nonpartisan Randy Dorn 1,333,290
52.38
Nonpartisan
Terry Bergeson (incumbent)
1,211,909
47.62
Total votes
2,545,199
100.00
Democratic hold
Insurance Commissioner
2008 Washington Insurance Commissioner election
County results Congressional district results Kreidler : 50–60% 60–70% 70–80% 80–90%Adams : 50–60% 60–70%
Blanket primary results by county
2008 Washington Insurance Commissioner election
Primary election
Party
Candidate
Votes
%
Democratic
Mike Kreidler (incumbent)
723,732
53.86
Republican
John Adams
484,992
36.09
Nonpartisan
Curtis Fackler
135,113
10.05
Total votes
1,343,837
100.00
General election
Democratic Mike Kreidler (incumbent) 1,679,696
61.38
Republican
John Adams
1,056,693
38.62
Total votes
2,736,389
100.00
Democratic hold
References
External links
.jpg)


.jpg)


.jpg)


.jpg)