2018 Missouri Senate election
| ||||||||||||||||||||||||||||||||||
17 even-numbered districts in the Missouri Senate 18 seats needed for a majority | ||||||||||||||||||||||||||||||||||
|---|---|---|---|---|---|---|---|---|---|---|---|---|---|---|---|---|---|---|---|---|---|---|---|---|---|---|---|---|---|---|---|---|---|---|
| ||||||||||||||||||||||||||||||||||
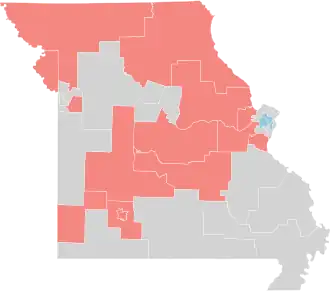 Results: Democratic hold Republican hold No election | ||||||||||||||||||||||||||||||||||
| ||||||||||||||||||||||||||||||||||
_(cropped).jpg)

| Elections in Missouri |
|---|
 |
The 2018 Missouri Senate elections were held on November 6, 2018, to elect the seventeen Missouri Senators to the Missouri Senate. Half of the Senate's thirty-four seats are up for election every two years, with each Senator serving four-year terms. The last time that these seats were up for election was the 2014 Missouri Senate election next time that these seats were up was in the 2022 Missouri Senate election.
Results summary
Statewide
| Party | Candi- dates |
Votes | Seats | ||||
|---|---|---|---|---|---|---|---|
| No. | % | No. | +/– | % | |||
| Republican Party | 16 | 710,940 | 58.59% | 14 | 82.35% | ||
| Democratic Party | 17 | 494,965 | 40.79% | 3 | 17.65% | ||
| Libertarian Party | 3 | 5,279 | 0.44% | 0 | 0.00% | ||
| Green Party | 1 | 2,114 | 0.17% | 0 | 0.00% | ||
| Write-Ins | 1 | 28 | 0.00% | 0 | 0.00% | ||
| Total | 38 | 1,213,326 | 100.00% | 17 | 100.00% | ||
District
Results of the 2018 Missouri State Senate elections by district:[1]
| District | Republican | Democratic | Others | Total | Result | ||||
|---|---|---|---|---|---|---|---|---|---|
| Votes | % | Votes | % | Votes | % | Votes | % | ||
| District 2 | 52,145 | 59.69% | 35,219 | 40.31% | - | - | 87,364 | 100.00% | Republican Hold |
| District 4 | 16,773 | 22.96% | 56,289 | 77.04% | - | - | 73,062 | 100.00% | Democratic Hold |
| District 6 | 52,861 | 73.22% | 17,783 | 24.63% | 1,548 | 2.15% | 72,192 | 100.00% | Republican Hold |
| District 8 | 41,094 | 54.69% | 34,052 | 45.31% | - | - | 75,146 | 100.00% | Republican Hold |
| District 10 | 48,277 | 70.31% | 20,384 | 29.69% | - | - | 68,661 | 100.00% | Republican Hold |
| District 12 | 49,947 | 72.50% | 18,950 | 27.50% | - | - | 68,897 | 100.00% | Republican Hold |
| District 14 | - | - | 51,815 | 100.00% | - | - | 51,815 | 100.00% | Democratic Hold |
| District 16 | 41,985 | 70.18% | 17,839 | 29.82% | - | - | 59,824 | 100.00% | Republican Hold |
| District 18 | 46,225 | 70.30% | 19,528 | 29.70% | - | - | 65,753 | 100.00% | Republican Hold |
| District 20 | 62,247 | 73.88% | 22,006 | 26.12% | - | - | 84,253 | 100.00% | Republican Hold |
| District 22 | 40,553 | 58.33% | 26,896 | 38.68% | 2,077 | 2.99% | 69,526 | 100.00% | Republican Hold |
| District 24 | 30,494 | 37.15% | 49,910 | 60.80% | 1,682 | 2.05% | 82,086 | 100.00% | Democratic Hold |
| District 26 | 53,143 | 64.02% | 29,866 | 35.98% | - | - | 83,009 | 100.00% | Republican Hold |
| District 28 | 53,659 | 79.18% | 14,113 | 20.82% | - | - | 67,772 | 100.00% | Republican Hold |
| District 30 | 34,506 | 53.35% | 30,175 | 46.65% | - | - | 64,681 | 100.00% | Republican Hold |
| District 32 | 48,383 | 73.73% | 15,125 | 23.05% | 2,114 | 3.22% | 65,622 | 100.00% | Republican Hold |
| District 34 | 38,648 | 52.47% | 35,015 | 47.53% | - | - | 73,663 | 100.00% | Republican Hold |
| Total | 710,940 | 58.59% | 494,965 | 40.79% | 7,421 | 0.61% | 1,213,326 | 100.00% | |
Close races
Districts where the margin of victory was under 10%:
- District 8, 9.38%
- District 30, 6.7%
- District 34, 4.94%
Predictions
| Source | Ranking | As of |
|---|---|---|
| Governing[2] | Likely R | October 8, 2018 |
District 2
Democratic primary
Primary results
| Party | Candidate | Votes | % | |
|---|---|---|---|---|
| Democratic | Patrice Billings | 16,711 | 100.0% | |
| Total votes | 16,711 | 100.0% | ||
Republican primary
Primary results
| Party | Candidate | Votes | % | |
|---|---|---|---|---|
| Republican | Bob Onder (incumbent) | 21,847 | 100.0% | |
| Total votes | 21,847 | 100.0% | ||
General election
Results
| Party | Candidate | Votes | % | ||
|---|---|---|---|---|---|
| Republican | Bob Onder (incumbent) | 52,145 | 59.69% | ||
| Democratic | Patrice Billings | 35,219 | 40.31% | ||
| Margin of victory | 16,926 | 19.38% | |||
| Total votes | 87,364 | 100.0% | |||
| Republican hold | |||||
District 4
Democratic primary
Primary results
| Party | Candidate | Votes | % | |
|---|---|---|---|---|
| Democratic | Karla May | 20,303 | 57.20% | |
| Democratic | Jacob Hummel (incumbent) | 15,189 | 42.80% | |
| Margin of victory | 5,114 | 14.40% | ||
| Total votes | 35,492 | 100.0% | ||
Republican primary
Primary results
| Party | Candidate | Votes | % | |
|---|---|---|---|---|
| Republican | Robert J. Crump | 4,743 | 100.0% | |
| Total votes | 4,743 | 100.0% | ||
General election
Results
| Party | Candidate | Votes | % | ||
|---|---|---|---|---|---|
| Democratic | Karla May | 56,289 | 77.04% | ||
| Republican | Robert J. Crump | 16,773 | 22.96% | ||
| Margin of victory | 39,516 | 54.08% | |||
| Total votes | 73,062 | 100.0% | |||
| Democratic hold | |||||
District 6
Democratic primary
Primary results
| Party | Candidate | Votes | % | |
|---|---|---|---|---|
| Democratic | Nicole Thompson | 4,746 | 55.84% | |
| Democratic | Bryan Struebig | 1,938 | 22.80% | |
| Democratic | Mollie Kristen Freebairn | 1,815 | 21.36% | |
| Margin of victory | 2,808 | 33.04% | ||
| Total votes | 8,499 | 100.0% | ||
Republican primary
Primary results
| Party | Candidate | Votes | % | |
|---|---|---|---|---|
| Republican | Mike Bernskoetter | 27,708 | 100.0% | |
| Total votes | 27,708 | 100.0% | ||
Libertarian primary
Primary results
| Party | Candidate | Votes | % | |
|---|---|---|---|---|
| Libertarian | Steve Wilson | 104 | 100.0% | |
| Total votes | 104 | 100.0% | ||
General election
Results
| Party | Candidate | Votes | % | ||
|---|---|---|---|---|---|
| Republican | Mike Bernskoetter | 52,861 | 73.22% | ||
| Democratic | Nicole Thompson | 17,783 | 24.63% | ||
| Libertarian | Steven Wilson | 1,520 | 2.11% | ||
| N/A | Write-Ins | 28 | 0.04% | ||
| Margin of victory | 35,078 | 48.59% | |||
| Total votes | 72,192 | 100.0% | |||
| Republican hold | |||||
District 8
Democratic primary
Primary results
| Party | Candidate | Votes | % | |
|---|---|---|---|---|
| Democratic | Hillary Shields | 16,089 | 100.0% | |
| Total votes | 16,089 | 100.0% | ||
Republican primary
Primary results
| Party | Candidate | Votes | % | |
|---|---|---|---|---|
| Republican | Mike Cierpiot (incumbent) | 16,836 | 89.02% | |
| Republican | Leonard Jonas Hughes IV | 2,076 | 10.98% | |
| Margin of victory | 14,760 | 78.04% | ||
| Total votes | 18,912 | 100.0% | ||
General election
Results
| Party | Candidate | Votes | % | ||
|---|---|---|---|---|---|
| Republican | Mike Cierpiot (incumbent) | 41,094 | 54.69% | ||
| Democratic | Hillary Shields | 34,052 | 45.31% | ||
| Margin of victory | 7,042 | 9.38% | |||
| Total votes | 75,146 | 100.0% | |||
| Republican hold | |||||
District 10
Democratic primary
Primary results
| Party | Candidate | Votes | % | |
|---|---|---|---|---|
| Democratic | Ayanna Shivers | 10,462 | 100.0% | |
| Total votes | 10,462 | 100.0% | ||
Republican primary
Primary results
| Party | Candidate | Votes | % | |
|---|---|---|---|---|
| Republican | Jeanie Riddle (incumbent) | 26,446 | 100.0% | |
| Total votes | 26,446 | 100.0% | ||
General election
Results
| Party | Candidate | Votes | % | ||
|---|---|---|---|---|---|
| Republican | Jeanie Riddle (incumbent) | 48,277 | 70.31% | ||
| Democratic | Ayanna Shivers | 20,384 | 29.69% | ||
| Margin of victory | 27,893 | 40.62% | |||
| Total votes | 68,661 | 100.0% | |||
| Republican hold | |||||
District 12
Democratic primary
Primary results
| Party | Candidate | Votes | % | |
|---|---|---|---|---|
| Democratic | Terry Richard | 8,924 | 100.0% | |
| Total votes | 8,924 | 100.0% | ||
Republican primary
Primary results
| Party | Candidate | Votes | % | |
|---|---|---|---|---|
| Republican | Dan Hegeman | 23,784 | 100.0% | |
| Total votes | 23,784 | 100.0% | ||
General election
Results
| Party | Candidate | Votes | % | ||
|---|---|---|---|---|---|
| Republican | Dan Hegeman (incumbent) | 49,947 | 72.50% | ||
| Democratic | Terry Richard | 18,950 | 27.50% | ||
| Margin of victory | 30,997 | 45.00% | |||
| Total votes | 68,897 | 100.0% | |||
| Republican hold | |||||
District 14
Democratic primary
Primary results
| Party | Candidate | Votes | % | |
|---|---|---|---|---|
| Democratic | Brian Williams | 12,615 | 40.19% | |
| Democratic | Sharon L. Pace | 11,782 | 37.53% | |
| Democratic | Joe Adams | 6,993 | 22.28% | |
| Margin of victory | 833 | 2.66% | ||
| Total votes | 31,390 | 100.0% | ||
General election
Results
| Party | Candidate | Votes | % | ||
|---|---|---|---|---|---|
| Democratic | Brian Williams | 51,815 | 100.0% | ||
| Total votes | 51,815 | 100.0% | |||
| Democratic hold | |||||
District 16
Democratic primary
Primary results
| Party | Candidate | Votes | % | |
|---|---|---|---|---|
| Democratic | Ryan Dillon | 6,017 | 100.0% | |
| Total votes | 6,017 | 100.0% | ||
Republican primary
Primary results
| Party | Candidate | Votes | % | |
|---|---|---|---|---|
| Republican | Justin Dan Brown (incumbent) | 10,535 | 40.06% | |
| Republican | Diane Franklin | 9,262 | 35.22% | |
| Republican | Keith Frederick | 6,500 | 24.72% | |
| Total votes | 26,297 | 100.0% | ||
General election
Results
| Party | Candidate | Votes | % | ||
|---|---|---|---|---|---|
| Republican | Justin Dan Brown (incumbent) | 41,985 | 70.18% | ||
| Democratic | Ryan Dillon | 17,839 | 29.82% | ||
| Margin of victory | 24,146 | 40.36% | |||
| Total votes | 59,824 | 100.0% | |||
| Republican hold | |||||
District 18
Democratic primary
Primary results
| Party | Candidate | Votes | % | |
|---|---|---|---|---|
| Democratic | Crystal Stephens | 9,733 | 100.0% | |
| Total votes | 9,733 | 100.0% | ||
Republican primary
Primary results
| Party | Candidate | Votes | % | |
|---|---|---|---|---|
| Republican | Cindy O'Laughlin | 9,893 | 36.70% | |
| Republican | Craig Redmon | 7,236 | 26.84% | |
| Republican | Nate Walker | 5,340 | 19.81% | |
| Republican | Lindell F. Shumake | 4,489 | 16.65% | |
| Margin of victory | 2,657 | 9.86% | ||
| Total votes | 26,958 | 100.0% | ||
General election
Results
| Party | Candidate | Votes | % | ||
|---|---|---|---|---|---|
| Republican | Cindy O'Laughlin | 46,225 | 70.30% | ||
| Democratic | Crystal Stephens | 19,528 | 29.70% | ||
| Margin of victory | 26,697 | 40.60% | |||
| Total votes | 65,753 | 100.0% | |||
| Republican hold | |||||
District 20
Democratic primary
Primary results
| Party | Candidate | Votes | % | |
|---|---|---|---|---|
| Democratic | Jim Billedo | 7,909 | 100.0% | |
| Total votes | 7,909 | 100.0% | ||
Republican primary
Primary results
| Party | Candidate | Votes | % | |
|---|---|---|---|---|
| Republican | Eric W. Burlison | 25,059 | 100.0% | |
| Total votes | 25,059 | 100.0% | ||
General election
Results
| Party | Candidate | Votes | % | ||
|---|---|---|---|---|---|
| Republican | Eric W. Burlison | 62,247 | 73.88% | ||
| Democratic | Jim Billedo | 22,006 | 26.12% | ||
| Margin of victory | 40,241 | 47.76% | |||
| Total votes | 84,253 | 100.0% | |||
| Republican hold | |||||
District 22
Democratic primary
Primary results
| Party | Candidate | Votes | % | |
|---|---|---|---|---|
| Democratic | Robert Butler | 10,706 | 66.95% | |
| Democratic | Edward Thurman | 5,286 | 33.05% | |
| Margin of victory | 5,420 | 33.90% | ||
| Total votes | 15,992 | 100.0% | ||
Republican primary
Primary results
| Party | Candidate | Votes | % | |
|---|---|---|---|---|
| Republican | Paul Wieland (incumbent) | 18,378 | 100.0% | |
| Total votes | 18,378 | 100.0% | ||
Libertarian primary
Primary results
| Party | Candidate | Votes | % | |
|---|---|---|---|---|
| Libertarian | Richie Camden | 309 | 100.0% | |
| Total votes | 309 | 100.0% | ||
General election
Results
| Party | Candidate | Votes | % | ||
|---|---|---|---|---|---|
| Republican | Paul Wieland (incumbent) | 40,553 | 58.33% | ||
| Democratic | Robert Butler | 26,896 | 38.68% | ||
| Libertarian | Richie Camden | 2,077 | 2.99% | ||
| Margin of victory | 11,580 | 19.65% | |||
| Total votes | 69,526 | 100.0% | |||
| Republican hold | |||||
District 24
Democratic primary
Primary results
| Party | Candidate | Votes | % | |
|---|---|---|---|---|
| Democratic | Jill Schupp (incumbent) | 27,548 | 100.0% | |
| Total votes | 27,548 | 100.0% | ||
Republican primary
Primary results
| Party | Candidate | Votes | % | |
|---|---|---|---|---|
| Republican | Gregory B. Powers | 11,229 | 100.0% | |
| Total votes | 11,229 | 100.0% | ||
Libertarian primary
Primary results
| Party | Candidate | Votes | % | |
|---|---|---|---|---|
| Libertarian | Jim Higgins | 225 | 100.0% | |
| Total votes | 225 | 100.0% | ||
General election
Results
| Party | Candidate | Votes | % | ||
|---|---|---|---|---|---|
| Democratic | Jill Schupp (incumbent) | 49,910 | 60.80% | ||
| Republican | Gregory B. Powers | 30,494 | 37.15% | ||
| Libertarian | Jim Higgins | 1,682 | 2.05% | ||
| Margin of victory | 19,416 | 23.65% | |||
| Total votes | 82,086 | 100.0% | |||
| Democratic hold | |||||
District 26
Democratic primary
Primary results
| Party | Candidate | Votes | % | |
|---|---|---|---|---|
| Democratic | John Kiehne | 13,950 | 100.0% | |
| Total votes | 13,950 | 100.0% | ||
Republican primary
Primary results
| Party | Candidate | Votes | % | |
|---|---|---|---|---|
| Republican | Dave Schatz (incumbent) | 24,992 | 100.0% | |
| Total votes | 24,992 | 100.0% | ||
General election
Results
| Party | Candidate | Votes | % | ||
|---|---|---|---|---|---|
| Republican | Dave Schatz (incumbent) | 53,143 | 64.02% | ||
| Democratic | John Kiehne | 29,866 | 35.98% | ||
| Margin of victory | 23,277 | 28.04% | |||
| Total votes | 83,009 | 100.0% | |||
| Republican hold | |||||
District 28
Democratic primary
Primary results
| Party | Candidate | Votes | % | |
|---|---|---|---|---|
| Democratic | Joe Poor | 6,590 | 100.0% | |
| Total votes | 6,590 | 100.0% | ||
Republican primary
Primary results
| Party | Candidate | Votes | % | |
|---|---|---|---|---|
| Republican | Sandy Crawford (incumbent) | 26,245 | 100.0% | |
| Total votes | 26,245 | 100.0% | ||
General election
Results
| Party | Candidate | Votes | % | ||
|---|---|---|---|---|---|
| Republican | Sandy Crawford (incumbent) | 53,659 | 79.18% | ||
| Democratic | Joe Poor | 14,113 | 20.82% | ||
| Margin of victory | 39,546 | 58.36% | |||
| Total votes | 67,772 | 100.0% | |||
| Republican hold | |||||
District 30
Democratic primary
Primary results
| Party | Candidate | Votes | % | |
|---|---|---|---|---|
| Democratic | Charlie Norr | 12,552 | 100.0% | |
| Total votes | 12,552 | 100.0% | ||
Republican primary
Primary results
| Party | Candidate | Votes | % | |
|---|---|---|---|---|
| Republican | Lincoln Hough | 15,952 | 100.0% | |
| Total votes | 15,952 | 100.0% | ||
General election
Results
| Party | Candidate | Votes | % | ||
|---|---|---|---|---|---|
| Republican | Lincoln Hough | 34,506 | 53.35% | ||
| Democratic | Charlie Norr | 30,175 | 46.65% | ||
| Margin of victory | 4,331 | 6.70% | |||
| Total votes | 64,681 | 100.0% | |||
| Republican hold | |||||
District 32
Democratic primary
Primary results
| Party | Candidate | Votes | % | |
|---|---|---|---|---|
| Democratic | Carolyn McGowan | 5,119 | 100.0% | |
| Total votes | 5,119 | 100.0% | ||
Republican primary
Primary results
| Party | Candidate | Votes | % | |
|---|---|---|---|---|
| Republican | Bill White | 17,478 | 64.16% | |
| Republican | Rob O'Brian | 9,765 | 35.84% | |
| Margin of victory | 7,713 | 28.32% | ||
| Total votes | 27,243 | 100.0% | ||
Green primary
Primary results
| Party | Candidate | Votes | % | |
|---|---|---|---|---|
| Green | Conon Gillis | 85 | 100.0% | |
| Total votes | 85 | 100.0% | ||
General election
Results
| Party | Candidate | Votes | % | ||
|---|---|---|---|---|---|
| Republican | Bill White | 48,383 | 73.73% | ||
| Democratic | Carolyn McGowan | 15,125 | 23.05% | ||
| Green | Conon Gillis | 2,114 | 3.22% | ||
| Margin of victory | 33,258 | 50.68% | |||
| Total votes | 65,622 | 100.0% | |||
| Republican hold | |||||
District 34
Democratic primary
Primary results
| Party | Candidate | Votes | % | |
|---|---|---|---|---|
| Democratic | Martin T. Rucker II | 15,033 | 100.0% | |
| Total votes | 15,033 | 100.0% | ||
Republican primary
Primary results
| Party | Candidate | Votes | % | |
|---|---|---|---|---|
| Republican | Tony Luetkemeyer | 11,679 | 53.67% | |
| Republican | Harry Roberts | 10,083 | 46.33% | |
| Margin of victory | 1,596 | 7.34% | ||
| Total votes | 21,762 | 100.0% | ||
General election
Results
| Party | Candidate | Votes | % | ||
|---|---|---|---|---|---|
| Republican | Tony Luetkemeyer | 38,648 | 52.47% | ||
| Democratic | Martin T. Rucker II | 35,015 | 47.53% | ||
| Margin of victory | 3,633 | 4.94% | |||
| Total votes | 73,663 | 100.0% | |||
| Republican hold | |||||
See also
References
- ^ a b c d e f g h i j k l m n o p q r "State of Missouri - General Election, November 06, 2018". Missouri Secretary of State. November 16, 2018.
- ^ Jacobson, Louis (October 8, 2018). "A Month Before Election Day, Democrats Poised for Legislative Gains". Governing. Retrieved June 27, 2024.
- ^ a b c d e f g h i j k l m n o p q r s t u v w x y z aa ab ac ad ae af ag ah ai aj ak "State of Missouri - Primary Election, August 07, 2018". Missouri Secretary of State. November 16, 2018.