2020 Venetian regional election Turnout 61.1% (
The 2020 Venetian regional election took place in Veneto on 20 and 21 September 2020.
Originally scheduled to take place on 31 May 2020, it was delayed due to the coronavirus pandemic in Italy [ 1] [ 2] round of multiple regional elections in Italy (7 regions out of 20). Venetian voters elected their President and their Regional Council , composed of 51 members including the President.
Luca Zaia , the second-term incumbent president and leading member of the League , was re-elected by a record 76.8% of the vote, the highest tally for a regional President in Italy. The runner-up, Arturo Lorenzoni , backed mainly by the Democratic Party , won 15.7% of the vote.
Regarding parties results, the League ran in this election presenting two lists: the official League list and a list named after Zaia. Combined, the two lists won 61.5% of the vote. The Democratic Party came second with 11.9% and Brothers of Italy came third with 9.6%.
Electoral system
The Regional Council of Veneto is composed of 50 seats. The president elect is the candidate winning a plurality of votes. The council seats are distributed according to proportional representation, with a majority bonus system assigning 60% of the 50 seats to the lists running with the candidate winning more than 40% of the votes.[ 3]
A single list must win at least 3% of the votes in order to access the seats distribution, while a coalition must win over 5% of the votes.[ 3]
Parties and candidates
Opinion polls
Candidates
Date
Polling firm/
Sample size
Zaia
Lorenzoni
Cappelletti
Sbrollini
Others
Undecided
Lead
21 Sep 2020
Opinio (exit poll)
–
72.0–76.0
16.0–20.0
3.0–5.0
0.0–2.0
–
–
56.0
21 Sep 2020
Tecnè (intention poll)
–
71.5–75.5
16.0–20.0
2.0–6.0
—
–
–
55.5
1–3 Sep 2020
Ipsos
850
74.0
16.3
4.9
1.0
3.8
8.8
57.7
27 Aug–1 Sep 2020
Demos
610
76.0
14.0
—
—
10.0
30.0
62.0
24 Aug–2 Sep 2020
Noto
—
71–75
18–22
2–6
—
1–5
—
49–57
24 Aug 2020
Tecnè
2,000
70–74
16–20
3–7
2–4
2–4
—
50–58
19–20 Aug 2020
Winpoll
1,008
76.8
15.5
3.8
1.1
2.8
18.0
61.3
30–31 Jul 2020
Tecnè
1,000
70.0
18.0
6.0
4.0
2.0
17.7
52.0
24–25 Jun 2020
Noto
1,000
70.0
18.0
7.0
2.0
3.0
—
52.0
Parties
Date
Polling firm
Sample size
Centre-right
Centre-left
M5S
IV
PdV
Others
Undecided
Lead
Zaia
Lega
FI
FdI
PD
VCV
+Eu
EV
Other
1–3 Sep 2020
Ipsos
850
34.5
23.5
3.5
8.8
15.1
0.7
0.3
0.9
1.4
5.2
1.3
—
4.8
12.7
11.0
27 Aug–1 Sep 2020
Demos
610
44.0
14.0
4.0
9.0
13.0
—
—
—
4.0
—
—
—
12.0
35.0
30.0
19–20 Aug 2020
Winpoll
1,008
33.6
26.8
3.3
10.3
10.7
3.0
0.9
—
2.0
4.7
1.8
—
2.9
—
6.8
3–5 Aug 2020
Fabbrica Politica
500
36.8
31.4
2.8
9.7
9.2
1.2
1.4
0.9
—
1.9
0.5
3.8
0.4
34.0
5.4
Results
20–21 September 2020 Venetian regional election results
Candidates
Votes
%
Seats
Parties
Votes
%
Seat
Luca Zaia 1,883,959
76.79
1
Zaia for President
916,087
44.57
23
League – Venetian League [ 4] 347,832
16.92
9
Brothers of Italy
196,310
9.55
5
Forza Italia
73,244
3.56
2
Venetian Autonomy List
48,932
2.38
1
Total
1,582,405
77.00
40
Arturo Lorenzoni
385,768
15.72
1
Democratic Party
244,881
11.92
6
Veneto We Want
41,275
2.01
1
Green Europe
34,647
1.69
1
More Veneto in Europe – Volt
14,246
0.69
–
Venetian Left
2,405
0.12
–
Total
337,454
16.42
8
Enrico Cappelletti
79,662
3.25
–
Five Star Movement
55,281
2.69
1
Paolo Girotto
21,679
0.88
–
3V Movement
14,916
0.73
–
Antonio Guadagnini
20,502
0.84
–
Party of Venetians
19,756
0.96
–
Paolo Benvegnù
18,529
0.76
–
Solidarity Environment Work
11,846
0.58
–
Daniela Sbrollini
15,198
0.62
–
Italia Viva – PSI – PRI
12,426
0.60
–
Patrizia Bertelle
14,518
0.59
–
Veneto Ecology Solidarity
9,061
0.44
–
Simonetta Rubinato
13,703
0.56
–
Veneto for the Autonomies
12,028
0.59
–
Total candidates
2,453,518
100.00
2
Total parties
2,055,173
100.00
49
Source: Ministry of the Interior – Electoral Archive
Popular vote
Zaia
44.57%
Lega
16.92%
PD
11.92%
FdI
9.55%
FI
3.56%
M5S
2.69%
LVA
2.38%
VCV
2.01%
EV
1.69%
Others
4.71%
President
Zaia
76.79%
Lorenzoni
15.72%
Cappelletti
3.25%
Others
4.24%
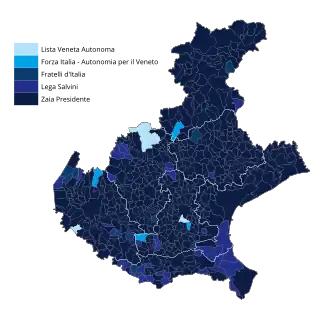
Results by province and capital city
Province
Luca Zaia
Arturo Lorenzoni
Others
Belluno
75,710
15,456
9,663
Padua
364,551
88,046
34,617
Rovigo
88,691
19,045
8,377
Treviso
351,419
59,222
34,052
Venice
314,524
71,692
37,207
Verona
345,384
64,015
31,058
Vicenza
343,680
68,292
31,817
Total
1,883,959
385,768
183,791
City
Luca Zaia
Arturo Lorenzoni
Others
Belluno
11,880
3,809
1,284
Padua
60,421
32,301
7,260
Rovigo
17,499
5,348
1,990
Treviso
27,799
9,147
3,358
Venice
82,587
29,400
11,343
Verona
82,193
25,622
9,977
Vicenza
34,163
12,251
4,339
Turnout
Region
Time
20 Sep
21 Sep
12:00
19:00
23:00
15:00
Veneto
14.73%
35.55%
46.13%
61.14%
Province
Time
20 Sep
21 Sep
12:00
19:00
23:00
15:00
Belluno
11.45%
26.94%
34.91%
47.84%
Padua
15.78%
38.38%
49.50%
65.43%
Rovigo
14.79%
34.73%
44.66%
59.87%
Treviso
14.07%
33.68%
44.15%
58.27%
Venice
15.27%
36.49%
46.73%
62.52%
Verona
14.59%
35.61%
46.91%
61.95%
Vicenza
14.92%
36.36%
46.98%
61.80%
Source: Ministry of the Interior – Turnout
See also
References
Regional elections General elections European Parliament elections Referendums
Elections in Italian regions