2021 Leicestershire County Council election
| |||||||||||||||||||||||||||||||||||||
All 55 seats to Leicestershire County Council 28 seats needed for a majority | |||||||||||||||||||||||||||||||||||||
|---|---|---|---|---|---|---|---|---|---|---|---|---|---|---|---|---|---|---|---|---|---|---|---|---|---|---|---|---|---|---|---|---|---|---|---|---|---|
| |||||||||||||||||||||||||||||||||||||
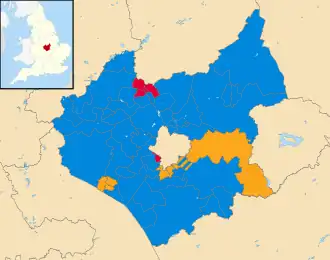 Map showing the results of the 2021 Leicestershire County Council elections. | |||||||||||||||||||||||||||||||||||||
| |||||||||||||||||||||||||||||||||||||
The 2021 Leicestershire County Council election took place alongside the other local elections. All councilors were elected from electoral divisions by first-past-the-post voting for a four-year term of office.[1]
Results
Overview
| 2021 Leicestershire County Council election[2] | ||||||||||
|---|---|---|---|---|---|---|---|---|---|---|
| Party | Candidates | Seats | Gains | Losses | Net gain/loss | Seats % | Votes % | Votes | +/− | |
| Conservative | 55 | 42 | 6 | 0 | 76.4 | 51.8 | 97,318 | +1.0 | ||
| Liberal Democrats | 52 | 9 | 0 | 4 | 16.4 | 18.9 | 35,481 | –2.3 | ||
| Labour | 54 | 4 | 0 | 2 | 7.3 | 20.3 | 38,220 | –0.3 | ||
| Green | 47 | 0 | 0 | 0 | 0.0 | 8.3 | 15,651 | +6.3 | ||
| Reform UK | 11 | 0 | 0 | 0 | 0.0 | 0.4 | 793 | N/A | ||
| Freedom Alliance (UK) | 4 | 0 | 0 | 0 | 0.0 | 0.1 | 187 | N/A | ||
| For Britain | 2 | 0 | 0 | 0 | 0.0 | 0.1 | 164 | N/A | ||
| SDP | 2 | 0 | 0 | 0 | 0.0 | <0.1 | 47 | N/A | ||
| TUSC | 1 | 0 | 0 | 0 | 0.0 | <0.1 | 41 | N/A | ||
Results by Division
Blaby
| Party | Seats | +/- | Votes | % | +/- | |
|---|---|---|---|---|---|---|
| Conservative | 6 | 15,245 | 56.1 | +1.5 | ||
| Labour | 1 | 4,917 | 18.1 | –2.6 | ||
| Liberal Democrats | 1 | 3,736 | 13.8 | +1.0 | ||
| Green | 0 | 3,086 | 11.4 | N/A | ||
| Independent | 0 | 181 | 0.7 | N/A | ||
| Total | 8 | 27,165 | ||||
Division results
| Party | Candidate | Votes | % | ±% | |
|---|---|---|---|---|---|
| Liberal Democrats | Geoff Welsh | 1,484 | 48.7 | −7.8 | |
| Conservative | Ryan Scott | 1,020 | 33.5 | +3.9 | |
| Labour | Suresh Chauhan | 304 | 10.0 | +0.2 | |
| Green | Rob Clarke | 235 | 7.7 | N/A | |
| Majority | |||||
| Liberal Democrats hold | Swing | ||||
| Party | Candidate | Votes | % | ±% | |
|---|---|---|---|---|---|
| Labour | Amanda Hack | 1,271 | 44.7 | −2.0 | |
| Conservative | Nigel Grundy | 1,142 | 40.1 | −4.6 | |
| Independent | David Di Palma | 181 | 6.4 | N/A | |
| Green | Mary Kapadia | 174 | 6.1 | N/A | |
| Liberal Democrats | Chris Merrill | 73 | 2.6 | N/A | |
| Majority | |||||
| Labour hold | Swing | ||||
| Party | Candidate | Votes | % | ±% | |
|---|---|---|---|---|---|
| Conservative | Les Phillimore | 1,962 | 58.4 | −5.4 | |
| Green | Will Read | 434 | 12.9 | N/A | |
| Liberal Democrats | Paul Hartshorn | 506 | 15.0 | 7.3 | |
| Labour | Zachary Atkins | 455 | 13.5 | −8.1 | |
| Majority | |||||
| Conservative hold | Swing | ||||
| Party | Candidate | Votes | % | ±% | |
|---|---|---|---|---|---|
| Conservative | Helen Richardson | 1,206 | 55.3 | −0.6 | |
| Labour | Lisa Pendery-Hunt | 639 | 29.3 | 1.7 | |
| Green | Steven Travis | 214 | 9.8 | N/A | |
| Liberal Democrats | Bev Welsh | 121 | 5.6 | −3.2 | |
| Majority | |||||
| Conservative hold | Swing | ||||
| Party | Candidate | Votes | % | ±% | |
|---|---|---|---|---|---|
| Conservative | Lee Breckon | 2,839 | 64.0 | +1.6 | |
| Conservative | Nick Chapman | 2,827 | 63.7 | +11.6 | |
| Labour | Malcolm Fox | 1,153 | 26.0 | +10.2 | |
| Green | Tony Deakin | 734 | 16.5 | +6.4 | |
| Green | Bettina Atkinson | 596 | 13.4 | N/A | |
| Liberal Democrats | Helen Gambardella | 495 | 11.2 | +0.3 | |
| Liberal Democrats | Mat Mortel | 285 | 6.4 | −3.0 | |
| Majority | |||||
| Conservative hold | Swing | ||||
| Conservative hold | Swing | ||||
| Party | Candidate | Votes | % | ±% | |
|---|---|---|---|---|---|
| Conservative | Terry Richardson | 1,755 | 61.2 | −4.7 | |
| Labour | Steve Cooper | 602 | 21.0 | −5.2 | |
| Green | Mike Jelfs | 348 | 12.1 | N/A | |
| Liberal Democrats | Antony Moseley | 161 | 5.6 | N/A | |
| Majority | |||||
| Conservative hold | Swing | ||||
| Party | Candidate | Votes | % | ±% | |
|---|---|---|---|---|---|
| Conservative | Maggie Wright | 2,494 | 63.1 | −10.1 | |
| Liberal Democrats | Luke Cousin | 611 | 15.4 | +6.0 | |
| Labour | Steve Crane | 493 | 12.4 | −4.9 | |
| Green | Nick Cox | 351 | 8.88 | N/A | |
| Majority | |||||
| Conservative hold | Swing | ||||
Charnwood
| Party | Seats | +/- | Votes | % | +/- | |
|---|---|---|---|---|---|---|
| Conservative | 11 | 22,241 | 51.8 | +0.6 | ||
| Labour | 3 | 12,577 | 29.3 | +0.4 | ||
| Green | 0 | 4,961 | 11.6 | +8.2 | ||
| Liberal Democrats | 0 | 2,761 | 6.4 | –2.8 | ||
| Reform UK | 0 | 333 | 0.8 | N/A | ||
| TUSC | 0 | 41 | 0.1 | N/A | ||
| For Britain | 0 | 37 | 0.1 | N/A | ||
| Total | 14 | 42,951 | ||||
Division results
| Party | Candidate | Votes | % | ±% | |
|---|---|---|---|---|---|
| Conservative | Daniel Grimley | 1,703 | 49.2 | +4.6 | |
| Labour | Julie Palmer | 1,224 | 35.3 | +14.5 | |
| Liberal Democrats | Rob Hewson | 531 | 15.3 | −14.8 | |
| Majority | |||||
| Conservative hold | Swing | ||||
| Party | Candidate | Votes | % | ±% | |
|---|---|---|---|---|---|
| Conservative | Deborah Taylor | 2,486 | 66.5 | −1.6 | |
| Labour | Dave Berry | 631 | 16.8 | +2.6 | |
| Green | Philip Mills | 401 | 10.7 | +6.5 | |
| Liberal Democrats | Kate Tipton | 220 | 5.9 | −2.4 | |
| Majority | |||||
| Conservative hold | Swing | ||||
| Party | Candidate | Votes | % | ±% | |
|---|---|---|---|---|---|
| Labour | Jewel Miah | 1,477 | 58.3 | −3.4 | |
| Conservative | Judy Shields | 628 | 24.8 | +1.4 | |
| Green | David Kellock | 246 | 9.7 | +5.6 | |
| Liberal Democrats | Emmanuel Fantaisie | 93 | 3.7 | −0.9 | |
| Reform UK | Chris Cooper | 86 | 3.4 | N/A | |
| Majority | |||||
| Labour hold | Swing | ||||
| Party | Candidate | Votes | % | ±% | |
|---|---|---|---|---|---|
| Labour | Betty Newton | 1,138 | 44.1 | −5.2 | |
| Conservative | Julie Mather | 1,122 | 43.5 | +8.6 | |
| Green | Wesley Walton | 214 | 8.3 | +3.2 | |
| Liberal Democrats | Philip Thornborow | 103 | 4.0 | +0.3 | |
| Majority | |||||
| Labour hold | Swing | ||||
| Party | Candidate | Votes | % | ±% | |
|---|---|---|---|---|---|
| Labour | Max Hunt | 1,187 | 50.9 | +2.2 | |
| Conservative | Pauline Ranson | 846 | 36.3 | +10.6 | |
| Green | Nigel Feetham | 151 | 6.5 | +4.2 | |
| Liberal Democrats | Jim Adcock | 103 | 4.4 | +1.5 | |
| TUSC | Damian Cosgrove | 41 | 1.8 | N/A | |
| Majority | |||||
| Labour hold | Swing | ||||
| Party | Candidate | Votes | % | ±% | |
|---|---|---|---|---|---|
| Conservative | Ted Parton | 1,318 | 48.1 | +0.1 | |
| Labour | Gill Bolton | 1,083 | 39.5 | −0.5 | |
| Green | Naomi Bottomley | 234 | 8.5 | +4.8 | |
| Liberal Democrats | Alex Guerrero | 105 | 3.8 | 0.0 | |
| Majority | |||||
| Conservative hold | Swing | ||||
| Party | Candidate | Votes | % | ±% | |
|---|---|---|---|---|---|
| Conservative | Jonathan Morgan | 1,850 | 45.4 | −7.4 | |
| Labour | Rowan Myall | 987 | 24.2 | +0.4 | |
| Liberal Democrats | Aidan Reed | 757 | 18.6 | +7.0 | |
| Green | Paul Goodman | 369 | 9.1 | +2.7 | |
| Reform UK | Jim Foxall | 104 | 2.6 | N/A | |
| Majority | |||||
| Conservative hold | Swing | ||||
| Party | Candidate | Votes | % | ±% | |
|---|---|---|---|---|---|
| Conservative | Hilary Fryer | 1,952 | 54.7 | +0.7 | |
| Labour | Josh Clayton | 1,000 | 28.0 | +6.0 | |
| Green | Mia Woolley | 373 | 10.4 | +6.2 | |
| Liberal Democrats | Carolyn Thornborow | 158 | 4.4 | −7.1 | |
| Reform UK | Andy McWilliam | 82 | 2.3 | N/A | |
| Majority | |||||
| Conservative hold | Swing | ||||
| Party | Candidate | Votes | % | ±% | |
|---|---|---|---|---|---|
| Conservative | Leon Hadji-Nikolaou | 1,804 | 56.0 | −7.6 | |
| Labour | Liz Blackshaw | 1,072 | 33.2 | +16.7 | |
| Green | Michelle Nelson | 203 | 6.3 | N/A | |
| Liberal Democrats | Alistair Duffy | 141 | 4.4 | −6.7 | |
| Majority | |||||
| Conservative hold | Swing | ||||
| Party | Candidate | Votes | % | ±% | |
|---|---|---|---|---|---|
| Conservative | Christine Radford | 2,051 | 60.0 | +9.0 | |
| Labour | Jane Lennie | 946 | 27.7 | −2.7 | |
| Green | John Hounsome | 239 | 7.0 | +4.6 | |
| Liberal Democrats | Katy Brookes-Duncan | 177 | 5.2 | −0.7 | |
| Majority | |||||
| Conservative hold | Swing | ||||
| Party | Candidate | Votes | % | ±% | |
|---|---|---|---|---|---|
| Conservative | Richard Shepherd | 1,722 | 57.2 | −2.2 | |
| Labour | Andrew Seggie | 618 | 20.5 | −0.1 | |
| Green | Billy Richards | 382 | 12.7 | +7.4 | |
| Liberal Democrats | Ian Sharpe | 187 | 6.2 | −3.1 | |
| For Britain | George Addinall | 37 | 1.2 | N/A | |
| Reform UK | Pete Morris | 61 | 2.0 | N/A | |
| Majority | |||||
| Conservative hold | Swing | ||||
| Party | Candidate | Votes | % | ±% | |
|---|---|---|---|---|---|
| Conservative | James Poland | 1,820 | 59.5 | −8.1 | |
| Green | Laurie Needham | 980 | 32.0 | +26.8 | |
| Labour | Samanta Zubrute | 256 | 8.4 | −6.5 | |
| Majority | |||||
| Conservative hold | Swing | ||||
| Party | Candidate | Votes | % | ±% | |
|---|---|---|---|---|---|
| Conservative | Tom Barkley | 1,291 | 47.4 | −10.2 | |
| Green | Louisa Wait | 1169 | 42.9 | +34.5 | |
| Labour | Lyndsey Derbyshire | 259 | 9.5 | −11.3 | |
| Majority | |||||
| Conservative hold | Swing | ||||
| Party | Candidate | Votes | % | ±% | |
|---|---|---|---|---|---|
| Conservative | Brenda Seaton | 1,648 | 65.0 | +11.0 | |
| Labour | Abe Khayer | 699 | 27.5 | −5.9 | |
| Liberal Democrats | Nitesh Dave | 186 | 7.3 | +1.5 | |
| Majority | |||||
| Conservative hold | Swing | ||||
Harborough
| Party | Seats | +/- | Votes | % | +/- | |
|---|---|---|---|---|---|---|
| Conservative | 6 | 14,039 | 50.9 | –3.2 | ||
| Liberal Democrats | 1 | 7,378 | 26.8 | –3.6 | ||
| Labour | 0 | 3,693 | 13.4 | +1.7 | ||
| Green | 0 | 2,462 | 8.9 | +6.2 | ||
| Total | 7 | 27,572 | ||||
Division results
| Party | Candidate | Votes | % | ±% | |
|---|---|---|---|---|---|
| Conservative | Neil Bannister | 1,589 | 52.8 | −17.1 | |
| Liberal Democrats | Mark Graves | 969 | 32.2 | +17.5 | |
| Labour | Christina Emmett | 239 | 7.9 | −7.3 | |
| Green | Mark Green | 210 | 7.0 | N/A | |
| Majority | |||||
| Conservative hold | Swing | ||||
| Party | Candidate | Votes | % | ±% | |
|---|---|---|---|---|---|
| Conservative | Blake Pain | 2,478 | 59.8 | −8.1 | |
| Liberal Democrats | Stephen Walkley | 747 | 18.0 | +1.3 | |
| Labour | David Gair | 545 | 13.1 | −2.1 | |
| Green | Mary Smith | 371 | 9.0 | N/A | |
| Majority | |||||
| Conservative hold | Swing | ||||
| Party | Candidate | Votes | % | ±% | |
|---|---|---|---|---|---|
| Conservative | Kevin Feltham | 2,357 | 62.1 | −5.4 | |
| Liberal Democrats | Trish Formoy | 537 | 14.1 | +2.8 | |
| Labour | Aime Armstrong | 510 | 13.4 | +1.8 | |
| Green | Gillian Buswell | 388 | 10.2 | +5.0 | |
| Majority | |||||
| Conservative hold | Swing | ||||
| Party | Candidate | Votes | % | ±% | |
|---|---|---|---|---|---|
| Liberal Democrats | Simon Galton | 1,986 | 45.1 | −10.9 | |
| Conservative | Michael Rickman | 1,796 | 40.8 | +7.0 | |
| Labour | Matt Smith | 392 | 8.9 | +3.8 | |
| Green | Melanie Walkley | 222 | 5.1 | +3.1 | |
| Majority | 190 | 4.3% | −17.9% | ||
| Liberal Democrats hold | Swing | -8.95% | |||
| Party | Candidate | Votes | % | ±% | |
|---|---|---|---|---|---|
| Conservative | Rosita Page | 2,170 | 55.7 | −7.0 | |
| Labour | Paul Beadle | 941 | 24.1 | +7.7 | |
| Liberal Democrats | Martin Sarfas | 489 | 12.5 | −8.3 | |
| Green | Carl Tiivas | 294 | 7.6 | N/A | |
| Majority | |||||
| Conservative hold | Swing | ||||
| Party | Candidate | Votes | % | ±% | |
|---|---|---|---|---|---|
| Conservative | Barry Champion | 1,887 | 42.1 | +1.7 | |
| Liberal Democrats | Sarah Hill | 1,712 | 38.2 | −8.2 | |
| Labour | Maria Panter | 506 | 11.3 | +2.2 | |
| Green | Mary Morgan | 371 | 8.3 | +4.3 | |
| Majority | |||||
| Conservative gain from Liberal Democrats | Swing | ||||
| Party | Candidate | Votes | % | ±% | |
|---|---|---|---|---|---|
| Conservative | Phil King | 1,762 | 45.5 | +0.3 | |
| Liberal Democrats | Peter James | 938 | 24.2 | −12.0 | |
| Green | Darren Woodiwiss | 606 | 15.6 | +8.5 | |
| Labour | Anne Pridmore | 560 | 14.4 | +3.0 | |
| Majority | |||||
| Conservative hold | Swing | ||||
Hinckley and Bosworth
| Party | Seats | +/- | Votes | % | +/- | |
|---|---|---|---|---|---|---|
| Conservative | 6 | 15,427 | 51.3 | +1.6 | ||
| Liberal Democrats | 3 | 9,793 | 32.6 | +3.1 | ||
| Labour | 0 | 3,836 | 12.8 | –0.3 | ||
| Green | 0 | 816 | 2.7 | N/A | ||
| Reform UK | 0 | 137 | 0.5 | N/A | ||
| SDP | 0 | 47 | 0.2 | N/A | ||
| Total | 9 | 30,056 | ||||
Division results
| Party | Candidate | Votes | % | ±% | |
|---|---|---|---|---|---|
| Conservative | Amanda Wright | 1,963 | 48.3 | −5.8 | |
| Liberal Democrats | Barry Walker | 1.693 | 41.7 | +9.6 | |
| Labour | Robert Martin | 372 | 9.2 | +0.1 | |
| SDP | Roger Hill | 29 | 0.7 | N/A | |
| Majority | |||||
| Conservative hold | Swing | ||||
| Party | Candidate | Votes | % | ±% | |
|---|---|---|---|---|---|
| Liberal Democrats | Michael Mullaney | 1,957 | 55.7 | +2.9 | |
| Conservative | Jan Kirby | 1,303 | 37.1 | −2.1 | |
| Labour | Heather White | 252 | 7.2 | −0.7 | |
| Majority | |||||
| Liberal Democrats hold | Swing | ||||
| Party | Candidate | Votes | % | ±% | |
|---|---|---|---|---|---|
| Conservative | Richard Allen | 1,762 | 61.7 | +2.3 | |
| Labour | Rick Middleton | 553 | 19.3 | −3.4 | |
| Liberal Democrats | Sandra Francks | 290 | 10.1 | +0.5 | |
| Green | Lewis Orton | 153 | 5.4 | N/A | |
| Reform UK | Peter Cheshire | 94 | 3.3 | N/A | |
| Majority | |||||
| Conservative hold | Swing | ||||
| Party | Candidate | Votes | % | ±% | |
|---|---|---|---|---|---|
| Conservative | Ozzy O'Shea | 2,396 | 75.4 | −0.8 | |
| Labour | Rebecca Pawley | 357 | 11.2 | −2.7 | |
| Liberal Democrats | Ted Hollick | 280 | 8.8 | +3.1 | |
| Green | Mark Wren | 144 | 4.5 | N/A | |
| Majority | |||||
| Conservative hold | Swing | ||||
| Party | Candidate | Votes | % | ±% | |
|---|---|---|---|---|---|
| Liberal Democrats | David Bill | 1,592 | 57.1 | +3.2 | |
| Conservative | Russ Roberts | 906 | 32.5 | +2.8 | |
| Labour | Andre Wheeler | 288 | 10.3 | +0.3 | |
| Majority | |||||
| Liberal Democrats hold | Swing | ||||
| Party | Candidate | Votes | % | ±% | |
|---|---|---|---|---|---|
| Conservative | Ross Hills | 1,536 | 46.4 | +12.1 | |
| Liberal Democrats | Mark Sheppard-Bools | 1,468 | 44.4 | −0.9 | |
| Labour | Jim Buck | 302 | 9.1 | −3.6 | |
| Majority | |||||
| Conservative gain from Liberal Democrats | Swing | ||||
| Party | Candidate | Votes | % | ±% | |
|---|---|---|---|---|---|
| Conservative | Bertie Harrison-Rushton | 2,541 | 66.8 | −4.3 | |
| Liberal Democrats | Muriel Crooks | 521 | 13.7 | +2.6 | |
| Labour | Kevin Ennis | 399 | 10.5 | −2.0 | |
| Green | Alec Duthie | 344 | 9.0 | N/A | |
| Majority | |||||
| Conservative hold | Swing | ||||
| Party | Candidate | Votes | % | ±% | |
|---|---|---|---|---|---|
| Conservative | Peter Bedford | 2,091 | 54.0 | +6.4 | |
| Labour | Andy Furlong | 951 | 24.5 | +6.0 | |
| Liberal Democrats | Robin Webber-Jones | 608 | 15.7 | +7.3 | |
| Green | Matthew Thorogood | 175 | 4.5 | N/A | |
| Reform UK | Bill Piper | 43 | 1.1 | N/A | |
| Majority | |||||
| Conservative hold | Swing | ||||
| Party | Candidate | Votes | % | ±% | |
|---|---|---|---|---|---|
| Liberal Democrats | Stuart Bray | 1,384 | 51.3 | +6.6 | |
| Conservative | Tom Lee | 930 | 34.5 | +1.2 | |
| Labour | Rosie Lythgoe-Cheetham | 362 | 13.4 | +1.0 | |
| SDP | Paul Forrest | 18 | 0.7 | N/A | |
| Majority | |||||
| Liberal Democrats hold | Swing | ||||
Melton
| Party | Seats | +/- | Votes | % | +/- | |
|---|---|---|---|---|---|---|
| Conservative | 4 | 8,197 | 60.5 | –4.9 | ||
| Labour | 0 | 2,415 | 17.8 | +2.7 | ||
| Green | 0 | 1,055 | 7.8 | +1.5 | ||
| Independent | 0 | 991 | 7.3 | N/A | ||
| Liberal Democrats | 0 | 809 | 6.0 | –1.6 | ||
| Reform UK | 0 | 72 | 0.5 | N/A | ||
| Total | 4 | 13,539 | ||||
Division results
| Party | Candidate | Votes | % | ±% | |
|---|---|---|---|---|---|
| Conservative | Bryan Lovegrove | 2,530 | 67.7 | +1.7 | |
| Labour | Helen Cliff | 535 | 14.3 | +4.0 | |
| Green | Colette Stein | 412 | 11.0 | +2.1 | |
| Liberal Democrats | Sue Taylor | 259 | 6.9 | −1.0 | |
| Majority | |||||
| Conservative hold | Swing | ||||
| Party | Candidate | Votes | % | ±% | |
|---|---|---|---|---|---|
| Conservative | Pam Posnett | 1,826 | 54.0 | −10.2 | |
| Labour | Tim Litt | 800 | 23.6 | +9.6 | |
| Independent | Simon Lumley | 332 | 9.8 | N/A | |
| Green | Martyn Gower | 246 | 7.3 | −0.2 | |
| Liberal Democrats | Carol Weaver | 103 | 3.0 | −2.3 | |
| Reform UK | Marcus Wilson | 72 | 2.1 | ||
| Majority | |||||
| Conservative hold | Swing | ||||
| Party | Candidate | Votes | % | ±% | |
|---|---|---|---|---|---|
| Conservative | Mark Frisby | 1,425 | 53.3 | −7.3 | |
| Labour | Pip Allnatt | 620 | 23.2 | −6.6 | |
| Green | Alastair McQuillan | 397 | 14.8 | N/A | |
| Independent | Marilyn Gordon | 229 | 8.6 | −1.0 | |
| Majority | |||||
| Conservative hold | Swing | ||||
| Party | Candidate | Votes | % | ±% | |
|---|---|---|---|---|---|
| Conservative | Joe Orson | 2,416 | 64.3 | −5.3 | |
| Labour | Carol Hopkinson | 460 | 12.2 | +2.2 | |
| Liberal Democrats | Hamish McAuley | 447 | 11.9 | +3.9 | |
| Independent | Steven Carter | 430 | 11.4 | N/A | |
| Majority | |||||
| Conservative hold | Swing | ||||
North West Leicestershire
| Party | Seats | +/- | Votes | % | +/- | |
|---|---|---|---|---|---|---|
| Conservative | 8 | 14,201 | 50.5 | +2.1 | ||
| Labour | 0 | 8,060 | 28.6 | –1.4 | ||
| Liberal Democrats | 0 | 2,560 | 9.1 | –3.7 | ||
| Green | 0 | 2,165 | 7.7 | N/A | ||
| Independent | 0 | 565 | 2.0 | +1.7 | ||
| Freedom Alliance | 0 | 276 | 1.0 | N/A | ||
| Reform UK | 0 | 190 | 0.7 | N/A | ||
| For Britain | 0 | 127 | 0.5 | N/A | ||
| Total | 8 | 28,114 | ||||
Division results
| Party | Candidate | Votes | % | ±% | |
|---|---|---|---|---|---|
| Conservative | John Coxon | 1,964 | 49.5 | −4.3 | |
| Labour | Debra Jackson | 1,190 | 30.0 | −0.8 | |
| Green | Carl Benfield | 508 | 12.8 | N/A | |
| Liberal Democrats | Sheila Wyatt | 168 | 4.2 | −4.0 | |
| Freedom Alliance | Claire O'Callaghan | 89 | 2.2 | N/A | |
| Reform UK | Adam Tilbury | 46 | 1.2 | N/A | |
| Majority | |||||
| Conservative hold | Swing | ||||
| Party | Candidate | Votes | % | ±% | |
|---|---|---|---|---|---|
| Conservative | Trevor Pendleton | 1,537 | 46.6 | −10.8 | |
| Labour | Michael Hay | 849 | 25.7 | +0.2 | |
| Independent | Tony Saffell | 565 | 17.1 | N/A | |
| Green | Lucy Pratt | 232 | 7.0 | N/A | |
| Liberal Democrats | Moira Lynch | 111 | 3.4 | −4.8 | |
| Majority | |||||
| Conservative hold | Swing | ||||
| Party | Candidate | Votes | % | ±% | |
|---|---|---|---|---|---|
| Conservative | Craig Smith | 1,357 | 42.8 | +13.9 | |
| Labour | Terri Eynon | 1,069 | 33.7 | −7.4 | |
| Liberal Democrats | Marie French | 480 | 15.1 | −2.1 | |
| Green | David Robinson | 132 | 4.2 | N/A | |
| For Britain | Graham Partner | 127 | 4.0 | +1.7 | |
| Majority | |||||
| Conservative gain from Labour | Swing | ||||
| Party | Candidate | Votes | % | ±% | |
|---|---|---|---|---|---|
| Conservative | Keith Merrie | 1,584 | 43.2 | +15.4 | |
| Liberal Democrats | Michael Wyatt | 1,144 | 31.2 | −7.2 | |
| Labour | Charlotte le Grys | 688 | 18.7 | −7.1 | |
| Green | Mark Burns | 202 | 5.5 | N/A | |
| Freedom Alliance | Sadie Cubitt | 47 | 1.3 | N/A | |
| Majority | |||||
| Conservative gain from Liberal Democrats | Swing | ||||
| Party | Candidate | Votes | % | ±% | |
|---|---|---|---|---|---|
| Conservative | Robert Ashman | 1,620 | 52.8 | +9.8 | |
| Labour | Sean Sheahan | 1,114 | 36.3 | −8.2 | |
| Green | James Harrison | 200 | 6.5 | N/A | |
| Liberal Democrats | Yorick Lynch | 69 | 2.3 | −1.5 | |
| Reform UK | Mick Gee | 62 | 2.0 | N/A | |
| Majority | |||||
| Conservative gain from Labour | Swing | ||||
| Party | Candidate | Votes | % | ±% | |
|---|---|---|---|---|---|
| Conservative | Dan Harrison | 1,925 | 56.4 | +3.9 | |
| Labour | Carissma Griffiths | 1,010 | 29.6 | 0.0 | |
| Liberal Democrats | David Wyatt | 273 | 8.0 | +0.7 | |
| Green | Ian Wilson | 202 | 5.9 | N/A | |
| Majority | |||||
| Conservative hold | Swing | ||||
| Party | Candidate | Votes | % | ±% | |
|---|---|---|---|---|---|
| Conservative | Nick Rushton | 1,964 | 49.5 | −13.7 | |
| Labour | Gregory Parle | 1,190 | 30.0 | +12.4 | |
| Green | Ben Woolley | 508 | 12.8 | N/A | |
| Liberal Democrats | Paul Tyler | 168 | 4.2 | −6.9 | |
| Freedom Alliance | Claire Louise O'Callaghan | 89 | 2.2 | N/A | |
| Reform UK | Gareth Bott | 46 | 1.2 | N/A | |
| Majority | |||||
| Conservative hold | Swing | ||||
| Party | Candidate | Votes | % | ±% | |
|---|---|---|---|---|---|
| Conservative | Tony Gillard | 2,250 | 62.2 | +8.1 | |
| Labour | Dave Everitt | 950 | 26.2 | −4.2 | |
| Green | Liz Fletcher | 181 | 5.0 | N/A | |
| Liberal Democrats | Jake Windram | 147 | 4.1 | −2.9 | |
| Freedom Alliance | Sophie Cruse | 51 | 1.4 | N/A | |
| Reform UK | David Gunn | 36 | 1.0 | N/A | |
| Majority | |||||
| Conservative hold | Swing | ||||
Oadby and Wigston
| Party | Seats | +/- | Votes | % | +/- | |
|---|---|---|---|---|---|---|
| Liberal Democrats | 4 | 8,306 | 41.7 | –8.8 | ||
| Conservative | 1 | 7,288 | 36.6 | +6.1 | ||
| Labour | 0 | 3,147 | 15.8 | –1.6 | ||
| Green | 0 | 1,157 | 5.8 | N/A | ||
| Total | 5 | 19,898 | ||||
Division results
| Party | Candidate | Votes | % | ±% | |
|---|---|---|---|---|---|
| Liberal Democrats | Michael Charlesworth | 1,390 | 44.8 | −15.4 | |
| Conservative | Liz Darling | 1,292 | 41.6 | +12.8 | |
| Labour | Rob Brannen | 279 | 9.0 | −1.9 | |
| Green | Christopher Cooper-Hayes | 141 | 4.5 | N/A | |
| Majority | |||||
| Liberal Democrats hold | Swing | ||||
| Party | Candidate | Votes | % | ±% | |
|---|---|---|---|---|---|
| Liberal Democrats | Linda Broadley | 1,264 | 44.4 | −7.2 | |
| Conservative | Mukesh Davé | 852 | 29.9 | −1.2 | |
| Labour | Richard Keenan | 548 | 19.2 | +2.0 | |
| Green | Richard Ansell | 182 | 6.4 | N/A | |
| Majority | |||||
| Liberal Democrats hold | Swing | ||||
| Party | Candidate | Votes | % | ±% | |
|---|---|---|---|---|---|
| Liberal Democrats | Dean Gamble | 2,338 | 39.6 | −5.2 | |
| Conservative | Kamal Ghattoraya | 2,274 | 38.6 | +7.1 | |
| Liberal Democrats | Jeffrey Kaufman | 2,249 | 38.1 | −4.8 | |
| Conservative | Priti Joshi | 2,242 | 38.0 | +8.6 | |
| Labour | Hajira Piranie | 1,004 | 17.0 | −3.3 | |
| Labour | Helen Morrison | 998 | 16.9 | −0.9 | |
| Green | Bethan Painter | 439 | 7.4 | N/A | |
| Green | Sakile Simpson | 290 | 4.9 | N/A | |
| Majority | |||||
| Liberal Democrats hold | Swing | ||||
| Conservative gain from Liberal Democrats | Swing | ||||
| Party | Candidate | Votes | % | ±% | |
|---|---|---|---|---|---|
| Liberal Democrats | Bill Boulter | 1,065 | 50.3 | −10.4 | |
| Conservative | Oliver Bryan | 628 | 29.6 | +4.4 | |
| Labour | Steve Maggs | 318 | 15.0 | +1.0 | |
| Green | Mandy Sanders | 105 | 4.96 | N/A | |
| Majority | |||||
| Liberal Democrats hold | Swing | ||||
By-elections
Blaby & Glen Parva
| Party | Candidate | Votes | % | ±% | |
|---|---|---|---|---|---|
| Liberal Democrats | Sue Jordan | 989 | 61.2 | +12.5 | |
| Conservative | Nigel Grundy | 320 | 19.8 | −13.7 | |
| Labour | Laura Badland | 190 | 11.8 | +1.8 | |
| Green | Mike Jelfs | 116 | 7.2 | −0.5 | |
| Majority | 669 | 41.4 | +26.2 | ||
| Turnout | 1,615 | 17.0 | −15.1 | ||
| Registered electors | 9,530 | ||||
| Liberal Democrats hold | Swing | +13.1 | |||
Burbage
| Party | Candidate | Votes | % | ±% | |
|---|---|---|---|---|---|
| Liberal Democrats | Barry Walker | 1,496 | 51.3 | +9.6 | |
| Conservative | Maddie Lee | 880 | 30.2 | −18.1 | |
| Labour | James Ross | 401 | 13.8 | +4.6 | |
| Green | Rhiannon Carter | 138 | 4.7 | +4.7 | |
| Majority | 616 | 21.1 | |||
| Turnout | 2888 | 29.7 | |||
| Registered electors | 9,899 | ||||
| Liberal Democrats gain from Conservative | Swing | +13.8 | |||
References
- ^ "Leicestershire County Council | Serving the people of Leicestershire". www.leicestershire.gov.uk. Retrieved 3 February 2021.
- ^ "Election 2021". Leicestershire County Council. 2021. Retrieved 22 June 2021.