2024 Southampton City Council election
| ||||||||||||||||||||||||||||||||||||||||||||||||||||||||||
17 out of 51 seats to Southampton City Council 26 seats needed for a majority | ||||||||||||||||||||||||||||||||||||||||||||||||||||||||||
|---|---|---|---|---|---|---|---|---|---|---|---|---|---|---|---|---|---|---|---|---|---|---|---|---|---|---|---|---|---|---|---|---|---|---|---|---|---|---|---|---|---|---|---|---|---|---|---|---|---|---|---|---|---|---|---|---|---|---|
| ||||||||||||||||||||||||||||||||||||||||||||||||||||||||||
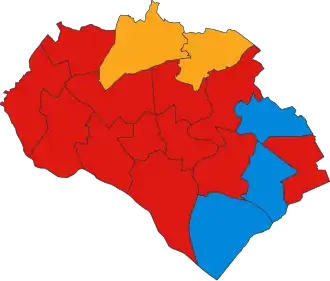 Winner of each seat at the 2024 Southampton City Council election | ||||||||||||||||||||||||||||||||||||||||||||||||||||||||||
| ||||||||||||||||||||||||||||||||||||||||||||||||||||||||||
The 2024 Southampton City Council election took place on 2 May 2024 to elect members of Southampton City Council in Hampshire, England.[2] This was on the same day as other local elections.
Labour retained their majority on the council.[3][4]
The Conservative leader of the opposition, Dan Fitzhenry, did not stand for re-election.[5] The Conservatives chose Peter Baillie to be their new group leader after the election.[6]
Summary
Election result
| 2024 Southampton City Council election | ||||||||||
|---|---|---|---|---|---|---|---|---|---|---|
| Party | This election | Full council | This election | |||||||
| Seats | Net | Seats % | Other | Total | Total % | Votes | Votes % | +/− | ||
| Labour | 12 | 70.6 | 24 | 36 | 70.6 | 19,148 | 39.9 | -5.6 | ||
| Conservative | 3 | 17.6 | 7 | 10 | 19.6 | 14,259 | 29.7 | -3.7 | ||
| Liberal Democrats | 2 | 11.8 | 2 | 4 | 7.8 | 6,073 | 12.7 | +0.0 | ||
| Green | 0 | 0.0 | 1 | 1 | 2.0 | 4,406 | 9.2 | +2.6 | ||
| TUSC | 0 | 0.0 | 0 | 0 | 0.0 | 1,920 | 4.0 | +2.8 | ||
| Reform UK | 0 | 0.0 | 0 | 0 | 0.0 | 1,727 | 3.6 | +3.1 | ||
| Independent | 0 | 0.0 | 0 | 0 | 0.0 | N/A | N/A | N/A | ||
Ward results
Source:[7]
Banister & Polygon
| Party | Candidate | Votes | % | ±% | |
|---|---|---|---|---|---|
| Labour Co-op | Vivienne Windle* | 1,006 | 46.1 | −3.3 | |
| Conservative | Scott Davis | 491 | 22.5 | +0.1 | |
| Green | Ellis Jackson | 337 | 15.4 | −4.1 | |
| Liberal Democrats | Andy Beal | 261 | 12.0 | −1.8 | |
| TUSC | Karen Rogers | 89 | 4.1 | −1.3 | |
| Majority | 515 | 23.6 | |||
| Turnout | 2,197 | 26.5 | –1.6 | ||
| Registered electors | 8,288 | ||||
| Labour Co-op hold | Swing | ||||
Bargate
| Party | Candidate | Votes | % | ±% | |
|---|---|---|---|---|---|
| Labour | Ginnie Lambert | 936 | 50.2 | +4.7 | |
| Conservative | Matt Jones | 497 | 26.6 | +0.7 | |
| Green | Joe Cox | 208 | 11.1 | −1.7 | |
| Liberal Democrats | Reuben Hinchliffe | 139 | 7.4 | +1.3 | |
| TUSC | Donna Dee | 86 | 4.6 | +1.0 | |
| Majority | 439 | 23.5 | |||
| Turnout | 1,884 | 22.2 | –0.7 | ||
| Registered electors | 8,486 | ||||
| Labour hold | Swing | ||||
Bassett
| Party | Candidate | Votes | % | ±% | |
|---|---|---|---|---|---|
| Liberal Democrats | Sarah Wood* | 1,481 | 43.9 | −4.3 | |
| Conservative | Amanda Guest | 964 | 28.6 | −4.8 | |
| Labour | Lawrence Coomber | 485 | 14.4 | +1.7 | |
| Green | Helen Makrakis | 198 | 5.9 | N/A | |
| Reform UK | Tom Randall | 194 | 5.8 | +0.4 | |
| TUSC | Aziz Dieng | 49 | 1.5 | N/A | |
| Majority | 517 | 15.3 | |||
| Turnout | 3,392 | 36.2 | –4.1 | ||
| Registered electors | 9,361 | ||||
| Liberal Democrats hold | Swing | ||||
Bevois
| Party | Candidate | Votes | % | ±% | |
|---|---|---|---|---|---|
| Labour | Jacqui Rayment* | 1,281 | 48.6 | −10.7 | |
| TUSC | Nadia Ditta | 848 | 32.2 | +27.8 | |
| Green | Rosanna Newey | 214 | 8.1 | −9.6 | |
| Conservative | Richard Palmer | 192 | 7.3 | −1.7 | |
| Liberal Democrats | Tom Wintrell | 102 | 3.9 | −4.9 | |
| Majority | 433 | 16.4 | |||
| Turnout | 2,681 | 30.4 | +3.2 | ||
| Registered electors | 8,795 | ||||
| Labour hold | Swing | ||||
Bitterne Park
| Party | Candidate | Votes | % | ±% | |
|---|---|---|---|---|---|
| Labour | Gordon Cooper | 1,634 | 42.8 | +0.4 | |
| Conservative | David Fuller | 1,545 | 40.4 | −0.2 | |
| Green | Lindsi Bluemel | 338 | 8.8 | −6.3 | |
| Reform UK | Adrian Royle | 160 | 4.2 | N/A | |
| Liberal Democrats | Nick Myers | 142 | 3.7 | −3.1 | |
| TUSC | Graham Henry | 63 | 1.6 | −2.0 | |
| Majority | 89 | 2.3 | |||
| Turnout | 3,899 | 37.3 | |||
| Registered electors | 10,459 | ||||
| Labour hold | Swing | ||||
Coxford
| Party | Candidate | Votes | % | ±% | |
|---|---|---|---|---|---|
| Labour Co-op | Beccy Greenhalgh* | 1,062 | 37.2 | −1.0 | |
| Conservative | Paul Nolan | 1,016 | 35.6 | +2.0 | |
| Reform UK | Guy Ireland | 256 | 9.0 | N/A | |
| Liberal Democrats | Ellen McGeorge | 213 | 7.5 | −2.7 | |
| Green | Joanne Clements | 176 | 6.2 | +0.6 | |
| TUSC | Maggie Fricker | 43 | 1.5 | ±0.0 | |
| Majority | 46 | 1.6 | |||
| Turnout | 2,873 | 30.3 | +7.1 | ||
| Registered electors | 9,982 | ||||
| Labour Co-op hold | Swing | ||||
Freemantle
| Party | Candidate | Votes | % | ±% | |
|---|---|---|---|---|---|
| Labour Co-op | Christie Lambert* | 1,339 | 49.9 | −4.3 | |
| Conservative | Diana Galton | 578 | 21.5 | −1.7 | |
| Green | John Spottiswoode | 275 | 10.2 | −7.9 | |
| Liberal Democrats | Chris Shank | 234 | 8.7 | +2.9 | |
| Reform UK | Katrina de Chazal | 174 | 6.5 | +2.4 | |
| TUSC | Catherine Clarke | 84 | 3.1 | −2.3 | |
| Majority | 761 | 28.4 | |||
| Turnout | 2,701 | 28.2 | –0.2 | ||
| Registered electors | 9,574 | ||||
| Labour Co-op hold | Swing | ||||
Harefield
| Party | Candidate | Votes | % | ±% | |
|---|---|---|---|---|---|
| Conservative | Rob Harwood | 1,219 | 43.5 | +0.7 | |
| Labour | Paul Kenny | 1,018 | 36.3 | −0.6 | |
| Liberal Democrats | Martyn Cooper | 303 | 10.8 | +1.1 | |
| Green | Chris Bluemel | 177 | 6.3 | −4.7 | |
| TUSC | Barbara Webber | 100 | 3.6 | +0.7 | |
| Majority | 201 | 7.2 | |||
| Turnout | 2,831 | 28.2 | –2.2 | ||
| Registered electors | 9,738 | ||||
| Conservative hold | Swing | ||||
Millbrook
| Party | Candidate | Votes | % | ±% | |
|---|---|---|---|---|---|
| Labour | Christian Cox* | 1,042 | 41.6 | −0.3 | |
| Conservative | Vikkie Cheng | 1,014 | 40.5 | −0.5 | |
| Green | Richard Fricker | 222 | 8.9 | −2.7 | |
| Liberal Democrats | Andrew Landells | 151 | 6.0 | −4.3 | |
| TUSC | Andrew Howe | 76 | 3.0 | −0.6 | |
| Majority | 28 | 1.1 | |||
| Turnout | 2,520 | 26.8 | –2.0 | ||
| Registered electors | 9,396 | ||||
| Labour hold | Swing | ||||
Peartree
| Party | Candidate | Votes | % | ±% | |
|---|---|---|---|---|---|
| Labour Co-op | Simon Letts* | 1,305 | 40.9 | +5.0 | |
| Conservative | Susan Spencer | 1,142 | 35.8 | +0.8 | |
| Reform UK | Sam Wright | 305 | 9.6 | N/A | |
| Green | Lori Foster | 219 | 6.9 | −3.8 | |
| Liberal Democrats | Tara Foster | 182 | 5.7 | −3.6 | |
| TUSC | Michael Marx | 34 | 1.1 | −1.4 | |
| Majority | 163 | 5.1 | |||
| Turnout | 3,202 | 30.0 | –2.6 | ||
| Registered electors | 10,687 | ||||
| Labour Co-op hold | Swing | ||||
Portswood
| Party | Candidate | Votes | % | ±% | |
|---|---|---|---|---|---|
| Labour | John Savage* | 1,401 | 46.3 | +9.0 | |
| Green | Neil Kelly | 880 | 29.1 | +3.1 | |
| Conservative | Nicholas Moulton | 365 | 12.1 | −7.5 | |
| Liberal Democrats | John Langran | 197 | 6.5 | +0.7 | |
| Reform UK | Caroline Jobson | 114 | 3.8 | +1.3 | |
| TUSC | Tony Twine | 67 | 2.2 | −0.1 | |
| Majority | 521 | 17.2 | |||
| Turnout | 3,034 | 36.5 | –3.8 | ||
| Registered electors | 8,308 | ||||
| Labour hold | Swing | ||||
Redbridge
| Party | Candidate | Votes | % | ±% | |
|---|---|---|---|---|---|
| Labour | Eugene McManus | 1,157 | 51.5 | +4.6 | |
| Conservative | Dave Smith | 520 | 23.2 | −7.9 | |
| Reform UK | John Edwards | 276 | 12.3 | +5.8 | |
| Green | Lisa Fricker | 147 | 6.5 | −2.1 | |
| Liberal Democrats | Simon Stokes | 125 | 5.6 | −0.3 | |
| TUSC | Pete Wyatt | 20 | 0.9 | −2.3 | |
| Majority | 637 | 28.4 | |||
| Turnout | 2,254 | 23.6 | –1.3 | ||
| Registered electors | 9,542 | ||||
| Labour hold | Swing | ||||
Shirley
| Party | Candidate | Votes | % | ±% | |
|---|---|---|---|---|---|
| Labour | Alice Kloker | 1,458 | 39.5 | −2.0 | |
| Conservative | Andrew Hetherton | 933 | 25.3 | −8.1 | |
| Liberal Democrats | George Percival | 734 | 19.9 | +7.5 | |
| Green | Lucy Allotey | 262 | 7.1 | −7.2 | |
| Reform UK | Philip Crook | 248 | 6.7 | N/A | |
| TUSC | Parveen Ishfaq | 54 | 1.5 | −0.9 | |
| Majority | 525 | 14.2 | |||
| Turnout | 3,703 | 36.1 | –1.3 | ||
| Registered electors | 10,262 | ||||
| Labour hold | Swing | ||||
Sholing
| Party | Candidate | Votes | % | ±% | |
|---|---|---|---|---|---|
| Conservative | Jaden Beaurain* | 1,367 | 46.2 | +4.3 | |
| Labour | Gillian Green | 1,002 | 33.9 | −1.7 | |
| Liberal Democrats | Sharon Hopkins | 348 | 11.8 | +0.6 | |
| Green | Emma Davis | 185 | 6.3 | −4.4 | |
| TUSC | Declan Clune | 57 | 1.9 | −1.5 | |
| Majority | 365 | 12.3 | |||
| Turnout | 2,995 | 29.0 | –0.9 | ||
| Registered electors | 10,339 | ||||
| Conservative hold | Swing | ||||
Swaythling
| Party | Candidate | Votes | % | ±% | |
|---|---|---|---|---|---|
| Liberal Democrats | Thomas Gravatt | 1,116 | 42.1 | +24.7 | |
| Labour | Sharon Mintoff* | 808 | 30.5 | −15.4 | |
| Conservative | Robert Painton | 407 | 15.4 | −5.9 | |
| Green | Angela Cotton | 246 | 9.3 | −8.7 | |
| TUSC | Nick Chaffey | 72 | 2.7 | −1.9 | |
| Majority | 308 | 11.6 | |||
| Turnout | 2,681 | 31.0 | +1.2 | ||
| Registered electors | 8,634 | ||||
| Liberal Democrats gain from Labour | Swing | ||||
Thornhill
| Party | Candidate | Votes | % | ±% | |
|---|---|---|---|---|---|
| Labour | Josh Allen* | 1,166 | 47.9 | +3.2 | |
| Conservative | Callum Ford | 924 | 37.9 | −1.2 | |
| Liberal Democrats | Edward Bolton | 142 | 5.8 | −0.9 | |
| Green | Michael Mawle | 126 | 5.2 | −2.3 | |
| TUSC | Clara Asher | 78 | 3.2 | +0.7 | |
| Majority | 242 | 9.9 | |||
| Turnout | 2,451 | 25.1 | –0.7 | ||
| Registered electors | 9,763 | ||||
| Labour hold | Swing | ||||
Woolston
| Party | Candidate | Votes | % | ±% | |
|---|---|---|---|---|---|
| Conservative | Rob Stead | 1,085 | 41.2 | +6.0 | |
| Labour | Victoria Ugwoeme* | 1,048 | 39.8 | −1.0 | |
| Liberal Democrats | Francis Hedley | 203 | 7.7 | −0.3 | |
| Green | Caitlin Steege | 196 | 7.5 | −7.1 | |
| TUSC | Sue Atkins | 100 | 3.8 | −1.2 | |
| Majority | 37 | 1.4 | |||
| Turnout | 2,658 | 25.4 | –1.5 | ||
| Registered electors | 10,451 | ||||
| Conservative gain from Labour | Swing | ||||
By-elections
Shirley
| Party | Candidate | Votes | % | ±% | |
|---|---|---|---|---|---|
| Liberal Democrats | George Percival | 1,249 | 39.2 | +19.3 | |
| Conservative | Andrew Hetherton | 770 | 24.2 | –1.1 | |
| Labour | Victoria Ugwoeme | 764 | 24.0 | –15.5 | |
| Green | Barrie Margetts | 241 | 7.6 | +0.5 | |
| Independent | Andrew Pope | 117 | 3.7 | N/A | |
| TUSC | Maggie Fricker | 44 | 1.4 | –0.1 | |
| Majority | 479 | 15.0 | N/A | ||
| Turnout | 3,185 | ||||
| Liberal Democrats gain from Labour | Swing | ||||
References
- ^ Lewis, Jason (26 April 2024). "Southampton parties' group leaders speak out ahead of election". Daily Echo. Retrieved 20 July 2024.
- ^ "Notice of Election" (PDF). Southampton City Council. 21 March 2024. Retrieved 9 April 2024.
- ^ "Southampton election result". BBC News. 3 May 2024. Retrieved 20 July 2024.
- ^ Edgley, Timothy (2 May 2024). "Southampton City Council elections 2024: Full list of results". Daily Echo. Retrieved 20 July 2024.
- ^ Ramos, Jose (18 January 2024). "Southampton Conservative leader Dan Fitzhenry to step down". Daily Echo. Retrieved 20 July 2024.
- ^ Lewis, Jason (14 May 2024). "New Conservative group leader on Southampton council announced". Daily Echo. Retrieved 20 July 2024.
- ^ "DECLARATION OF RESULT OF POLL" (PDF).