Qaisumah
Qaisumah
القيصومة | |
|---|---|
 | |
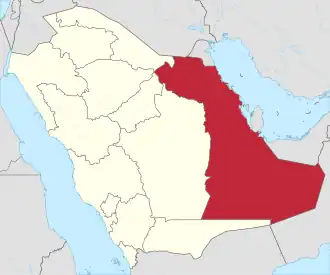 Qaisumah Location in Eastern Province, Saudi Arabia | |
| Coordinates: 28°18′35″N 046°07′39″E / 28.30972°N 46.12750°E | |
| Country | |
| Province | Eastern (Ash Sharqiyah) |
Qaisumah or Al Qaysumah (Arabic: القيصومة) is a village belonging to the city of Hafar al-Batin, in Eastern Province (also known as Ash Sharqiyah), Saudi Arabia. It is located at around 28°18′35″N 46°7′39″E / 28.30972°N 46.12750°E.
The weather in Qaisumah is extreme, with rainfall ranging between 5 and 10 mm (0.2 and 0.4 inches). Summer temperatures range from 45 to 51 degrees Celsius (113 to 124 degrees Fahrenheit). Whereas the winter temperatures may go below freezing (between -1 and 6 degrees Celsius / 30 and 43 degrees Fahrenheit), with the lowest temperature recorded as -6 degree Celsius (21 degrees Fahrenheit). The town has 100% Muslim population with no minorities in and around the town.
Climate
| Climate data for Al Qaysumah (1991-2020) | |||||||||||||
|---|---|---|---|---|---|---|---|---|---|---|---|---|---|
| Month | Jan | Feb | Mar | Apr | May | Jun | Jul | Aug | Sep | Oct | Nov | Dec | Year |
| Record high °C (°F) | 31.0 (87.8) |
34.8 (94.6) |
41.0 (105.8) |
44.0 (111.2) |
48.8 (119.8) |
50.3 (122.5) |
50.6 (123.1) |
51.0 (123.8) |
48.2 (118.8) |
44.5 (112.1) |
38.0 (100.4) |
31.5 (88.7) |
51.0 (123.8) |
| Mean daily maximum °C (°F) | 18.6 (65.5) |
21.8 (71.2) |
27.0 (80.6) |
33.5 (92.3) |
39.9 (103.8) |
43.7 (110.7) |
45.1 (113.2) |
45.4 (113.7) |
42.3 (108.1) |
36.4 (97.5) |
26.2 (79.2) |
20.2 (68.4) |
33.3 (91.9) |
| Daily mean °C (°F) | 12.0 (53.6) |
14.7 (58.5) |
19.6 (67.3) |
25.8 (78.4) |
32.2 (90.0) |
36.0 (96.8) |
37.4 (99.3) |
37.3 (99.1) |
33.9 (93.0) |
28.1 (82.6) |
19.2 (66.6) |
13.5 (56.3) |
25.8 (78.4) |
| Mean daily minimum °C (°F) | 6.3 (43.3) |
8.2 (46.8) |
12.6 (54.7) |
18.4 (65.1) |
24.2 (75.6) |
27.3 (81.1) |
28.9 (84.0) |
28.8 (83.8) |
25.5 (77.9) |
20.5 (68.9) |
13.0 (55.4) |
7.8 (46.0) |
18.5 (65.3) |
| Record low °C (°F) | −4.2 (24.4) |
−2.4 (27.7) |
0.0 (32.0) |
6.0 (42.8) |
15.0 (59.0) |
20.7 (69.3) |
20.8 (69.4) |
22.2 (72.0) |
16.0 (60.8) |
12.0 (53.6) |
0.6 (33.1) |
−3.0 (26.6) |
−4.2 (24.4) |
| Average precipitation mm (inches) | 18.7 (0.74) |
11.7 (0.46) |
14.0 (0.55) |
11.4 (0.45) |
3.4 (0.13) |
0.1 (0.00) |
0.0 (0.0) |
0.0 (0.0) |
0.0 (0.0) |
3.8 (0.15) |
27.2 (1.07) |
18.5 (0.73) |
108.8 (4.28) |
| Average precipitation days (≥ 1 mm) | 2.7 | 1.9 | 2.3 | 2.4 | 0.7 | 0.0 | 0.0 | 0.0 | 0.0 | 0.6 | 3.0 | 2.5 | 16.0 |
| Average relative humidity (%) | 59 | 48 | 38 | 31 | 18 | 13 | 12 | 13 | 16 | 25 | 43 | 56 | 31 |
| Source 1: World Meteorological Organization[1] | |||||||||||||
| Source 2: (humidity 1985-2010) "Jeddah Regional Climate Center South West Asia". Archived from the original on 2016-12-11. [2] | |||||||||||||
References
- ^ "World Meteorological Organization Climate Normals for 1991-2020 — Qaisumah". National Oceanic and Atmospheric Administration. Retrieved February 6, 2024.
- ^ "Surface annual climatological report". PME. Archived from the original on 2016-03-21. Retrieved 2016-01-30.