1994 Austrian European Union membership referendum
| ||||||||||||||||||||||
Shall the National Council's decision of 5 May 1994 on the Constitutional Law concerning the Accession of Austria to the European Union be enacted as law? | ||||||||||||||||||||||
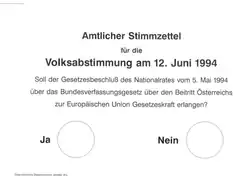 Official ballot paper for the referendum | ||||||||||||||||||||||
| Results | ||||||||||||||||||||||
|---|---|---|---|---|---|---|---|---|---|---|---|---|---|---|---|---|---|---|---|---|---|---|
| ||||||||||||||||||||||
 Referendum result by states.
| ||||||||||||||||||||||
| This article is part of a series on the |
| Politics of Austria |
|---|
 |
|
Wöginger • Babler • Kickl • Maurer • Meinl-Reisinger •
|
|
|
A referendum on European Union membership was held in Austria on 12 June 1994.[1] The question asked was "Shall the National Council's decision of 5 May 1994 on the Constitutional Law (Bundesverfassungsgesetz) concerning the Accession of Austria to the European Union be enacted as law?" The result of the vote was 67% in favour, with a turnout of 82%.[2] Austria subsequently joined the EU as part of the 1995 enlargement.
Party positions
| Position | Political parties | |
|---|---|---|
| Yes | Social Democratic Party of Austria | |
| Austrian People's Party | ||
| No | Freedom Party of Austria | |
| Green Alternative | ||
Results
| Choice | Votes | % | |
|---|---|---|---|
| For | 3,145,981 | 66.58 | |
| Against | 1,578,850 | 33.42 | |
| Total | 4,724,831 | 100.00 | |
| Valid votes | 4,724,831 | 99.09 | |
| Invalid/blank votes | 43,570 | 0.91 | |
| Total votes | 4,768,401 | 100.00 | |
| Registered voters/turnout | 5,790,578 | 82.35 | |
| Source: Nohlen & Stöver | |||
By state
| State | Registered voters | Valid (votes) | Yes (votes) | No (votes) | Yes (%) | No (%) |
|---|---|---|---|---|---|---|
| Burgenland | 213,090 | 198,279 | 148,041 | 50.238 | 74.7% | 25.3% |
| Styria | 907,991 | 728,037 | 501,481 | 226,556 | 68.9% | 31.1% |
| Kärnten | 420,630 | 340,867 | 232,457 | 108,410 | 68.2% | 31.8% |
| Lower Austria | 1,115,663 | 999,471 | 678,988 | 320,483 | 67.9% | 32.1% |
| Vorarlberg | 221,863 | 177,506 | 118,206 | 59,300 | 66.6% | 33.4% |
| Wien | 1,133,693 | 820,675 | 542,905 | 277,770 | 66.2% | 33.8% |
| Upper Austria | 974,865 | 824,512 | 539,965 | 284,547 | 65.5% | 34.5% |
| Salzburg | 347,387 | 284,283 | 184,948 | 99,335 | 65.1% | 34.9% |
| Tirol | 455,396 | 351,201 | 198.990 | 152,211 | 56.7% | 43.3% |
| Total | 5,790,578 | 4,724,831 | 3,145,981 | 1,578,850 | 66.6% | 33.4% |
References
| |||||||||||
| |||||||||||