List of countries by beer consumption per capita
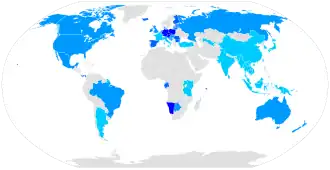
≥ 125 litres
100–125 litres
75–100 litres
50–75 litres
< 50 litres
This is a list of countries ordered by annual per capita consumption of beer. Information not provided for some countries is not given in the available sources. Note: The row number column is fixed. So you can choose what column to rank by clicking its header to sort it.
* indicates "Beer in COUNTRY or TERRITORY" links.
| Country | Consumption per capita[1] (litres per year) |
Total national consumption[a] (million litres per year) |
Year | Sources |
|---|---|---|---|---|
| 128.0 | 1,520 | 2023 | [2] | |
| 107.8 | 949 | 2019 | [1] | |
| 100.3 | 1,956 | 2019 | [1] | |
| 99.0 | 8,160 | 2019 | [1] | |
| 97.7 | 3,713 | 2019 | [1] | |
| 95.5 | 248 | 2019 | [1] | |
| 92.9 | 446 | 2019 | [1] | |
| 88.8 | 4,119 | 2019 | [1] | |
| 85.5 | 351 | 2019 | [1] | |
| 81.4 | 155 | 2019 | [1] | |
| 80.5 | 105 | 2019 | [1] | |
| 80.0 | 168 | 2019 | [1] | |
| 79.3 | 1,357 | 2019 | [1] | |
| 78.7 | 551 | 2019 | [1] | |
| 78.3 | 329 | 2019 | [1] | |
| 76.1 | 418 | 2019 | [1] | |
| 75.1 | 1,885 | 2019 | [1] | |
| 74.4 | 216 | 2019 | [1] | |
| 73.7 | 715 | 2019 | [1] | |
| 72.7 | 23,920 | 2019 | [1] | |
| 72.0 | 403 | 2019 | [1] | |
| 70.5 | 9,324 | 2019 | [1] | |
| 70.3 | 4,712 | 2019 | [1] | |
| 68.6 | 240 | 2019 | [1] | |
| 67.0 | 141 | 2019 | [1] | |
| 65.9 | 765 | 2019 | [1] | |
| 61.0 | 293 | 2019 | [1] | |
| 60.1 | 3,447 | 2018 | [1] | |
| 59.8 | 347 | 2019 | [1] | |
| 59.2 | 976 | 2019 | [1] | |
| 58.4 | 12,401 | 2019 | [1] | |
| 57.7 | 8,306 | 2019 | [1] | |
| 55.1 | 474 | 2019 | [1] | |
| 54.9 | 565 | 2019 | [1] | |
| 54.8 | 302 | 2019 | [1] | |
| 53.5 | 1,994 | 2019 | [1] | |
| 54.8 | 203 | 2018 | [1] | |
| 54.7 | 481 | 2018 | ||
| 47.0 | 2021 | [3] | ||
| 39.4 | 2,022 | 2019 | [1] | |
| 45.1 | 2,600 | 2020/21 | [4][5] | |
| 38.4 | 4,869 | 2019 | [1] | |
| 41.4 | 2015 | [6] | ||
| 33 | 2016 | [7] | ||
| 31 | 2016 | [8] | ||
| 29 | 43,266 | 2018 | [9] | |
| 27 | 2015 | [6] | ||
| 23.2 | 2015 | [6] | ||
| 21.2 | 159 | 2018 | [10] | |
| 20.9 | 2015 | [6] | ||
| 17.4 | 2013 | [11] | ||
| 10.9 | 2020 | [12] | ||
| 12 | [13] | |||
| 11.3 | 2015 | [6] | ||
| 11 | [14] | |||
| 10.9 | 2015 | [6] | ||
| 8.5 | 2016 | [15] | ||
| 8 | [13] | |||
| 6 | [13] | |||
| 5.8 | 2015 | [6] | ||
| 2 | 50 | [16] | ||
| 2 | 2015 | [6] | ||
| 0.7 | 2015 | [6] |
See also
Notes
- ^ Combination of per capita rates with respective populations at time of study. Data taken verbatim from the Kirin report.
References
- ^ a b c d e f g h i j k l m n o p q r s t u v w x y z aa ab ac ad ae af ag ah ai aj ak al am "Kirin Beer University Report Global Beer Consumption by Country in 2019" (PDF). www.kirinholdings.co.jp. Retrieved February 27, 2021.
- ^ "Pivovary v ČR loni uvařily méně piva a spotřeba klesla na 128 litrů na osobu". České noviny. 7 May 2024. Retrieved 29 May 2024.
- ^ "Beer consumption per capita in Cyprus 2008-2021". Statista. 16 Dec 2022. Retrieved 18 Apr 2023.
- ^ "Beer - Vietnam". statista: the statistics portal. Retrieved 2021-02-27.
- ^ "Vietnam: beer consumption volume by type 2021". Statista. Retrieved 2023-06-06.
- ^ a b c d e f g h i "Beer consumption per capita in the Asia Pacific region in 2015, by country (in liters)". statista: the statistics portal. Retrieved 2018-09-02.
- ^ "Annual volume of beer consumed per capita in France from 2008 to 2016". Retrieved August 9, 2018.
- ^ "AssoBirra annual report 2016" (PDF). Retrieved January 8, 2017.
- ^ "Beer - China". statista: the statistics portal. Retrieved 2018-09-02.
- ^ "Beer - Hong Kong". statista: the statistics portal. Retrieved 2018-09-02.
- ^ "Beer Consumption Per Capita in Israel". Retrieved 2018-09-04.
- ^ "Beer - Turkey". statista: the statistics portal. Retrieved 2021-02-27.
- ^ a b c Barigaba, Julius (August 17, 2009). "Uganda brewers toast to higher sales, thanks to low-end products". EastAfrican. Archived from the original on January 12, 2020. Retrieved October 13, 2010.
- ^ "Heineken Partners with Efes Breweries in Uzbekistan, Serbia and Kazakhstan". FlexNews. January 1, 2008. Retrieved October 13, 2010.
- ^ "Alcohol Consumption in Lebanon" (PDF). World Health Organization. WHO. Retrieved 19 February 2025.
- ^ "Lion seeks to reduce gearing through Rs. 1.2 bn. cash infusion". Sunday Island. August 16, 2009. Retrieved October 13, 2010.
External links
- List of beer production by region/by country
- Global Status Report on Alcohol and Health, 2014 (PDF). Geneva: World Health Organization. 2014. ISBN 978-92-4-069276-3.
| Africa |
|
|---|---|
| Asia | |
| Europe |
|
| North America | |
| South America | |
| Oceania | |