Challes-les-Eaux
Challes-les-Eaux
Chales (Arpitan) | |
|---|---|
.JPG) Challes-les-Eaux Town Hall | |
.svg.png) Coat of arms | |
Location of Challes-les-Eaux | |
 Challes-les-Eaux 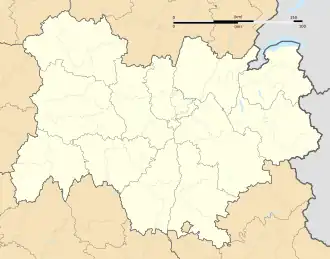 Challes-les-Eaux | |
| Coordinates: 45°32′43″N 5°58′49″E / 45.5453°N 5.9803°E | |
| Country | France |
| Region | Auvergne-Rhône-Alpes |
| Department | Savoie |
| Arrondissement | Chambéry |
| Canton | La Ravoire |
| Intercommunality | Grand Chambéry |
| Government | |
| • Mayor (2020–2026) | Josette Remy[1] |
Area 1 | 5.65 km2 (2.18 sq mi) |
| Population (2022)[2] | 5,626 |
| • Density | 1,000/km2 (2,600/sq mi) |
| Demonym | Challésiens / Challésiennes |
| Time zone | UTC+01:00 (CET) |
| • Summer (DST) | UTC+02:00 (CEST) |
| INSEE/Postal code | 73064 /73190 |
| Elevation | 290–565 m (951–1,854 ft) |
| Website | ville-challesleseaux.com |
| 1 French Land Register data, which excludes lakes, ponds, glaciers > 1 km2 (0.386 sq mi or 247 acres) and river estuaries. | |
Challes-les-Eaux (French pronunciation: [ʃal le.z‿o]; Arpitan: Chales), known as Triviers until 1872, is a commune in the Savoie department in the Auvergne-Rhône-Alpes region in Southeastern France. Chambéry Aerodrome is located in the commune.
Chambéry-Challes-les-Eaux station, located in Chambéry to the northwest of Challes-les-Eaux, bears the name of the commune along that of Chambéry.
Geography
Climate
Challes-les-Eaux has an oceanic climate (Köppen climate classification Cfb) closely bordering on a humid subtropical climate (Cfa). The average annual temperature in Challes-les-Eaux is 11.8 °C (53.2 °F). The average annual rainfall is 1,147.6 mm (45.18 in) with December as the wettest month.
The temperatures are highest on average in July, at around 21.5 °C (70.7 °F), and lowest in January, at around 2.3 °C (36.1 °F). The highest temperature ever recorded in Challes-les-Eaux was 39.8 °C (103.6 °F) on 31 July 2020; the coldest temperature ever recorded was −23.0 °C (−9.4 °F) on 14 January 1960.
| Climate data for Challes-les-Eaux (1991−2020 normals, extremes 1946−present) | |||||||||||||
|---|---|---|---|---|---|---|---|---|---|---|---|---|---|
| Month | Jan | Feb | Mar | Apr | May | Jun | Jul | Aug | Sep | Oct | Nov | Dec | Year |
| Record high °C (°F) | 21.5 (70.7) |
21.9 (71.4) |
27.1 (80.8) |
29.5 (85.1) |
33.7 (92.7) |
37.5 (99.5) |
39.8 (103.6) |
39.7 (103.5) |
33.6 (92.5) |
30.6 (87.1) |
25.3 (77.5) |
23.3 (73.9) |
39.8 (103.6) |
| Mean daily maximum °C (°F) | 6.4 (43.5) |
8.7 (47.7) |
13.9 (57.0) |
17.7 (63.9) |
21.7 (71.1) |
25.6 (78.1) |
28.1 (82.6) |
27.7 (81.9) |
22.8 (73.0) |
17.4 (63.3) |
10.8 (51.4) |
6.8 (44.2) |
17.3 (63.1) |
| Daily mean °C (°F) | 2.3 (36.1) |
3.6 (38.5) |
7.8 (46.0) |
11.4 (52.5) |
15.6 (60.1) |
19.4 (66.9) |
21.5 (70.7) |
21.1 (70.0) |
16.9 (62.4) |
12.3 (54.1) |
6.5 (43.7) |
2.9 (37.2) |
11.8 (53.2) |
| Mean daily minimum °C (°F) | −1.8 (28.8) |
−1.5 (29.3) |
1.7 (35.1) |
5.1 (41.2) |
9.5 (49.1) |
13.2 (55.8) |
15.0 (59.0) |
14.6 (58.3) |
11.0 (51.8) |
7.2 (45.0) |
2.3 (36.1) |
−1.0 (30.2) |
6.3 (43.3) |
| Record low °C (°F) | −23.0 (−9.4) |
−22.1 (−7.8) |
−16.1 (3.0) |
−8.1 (17.4) |
−4.0 (24.8) |
0.3 (32.5) |
3.1 (37.6) |
3.9 (39.0) |
−1.2 (29.8) |
−6.0 (21.2) |
−12.8 (9.0) |
−19.9 (−3.8) |
−23.0 (−9.4) |
| Average precipitation mm (inches) | 95.1 (3.74) |
74.0 (2.91) |
86.5 (3.41) |
83.4 (3.28) |
99.7 (3.93) |
97.2 (3.83) |
93.3 (3.67) |
100.2 (3.94) |
97.1 (3.82) |
101.3 (3.99) |
107.6 (4.24) |
112.2 (4.42) |
1,147.6 (45.18) |
| Average precipitation days (≥ 1.0 mm) | 10.4 | 8.5 | 9.7 | 9.8 | 11.1 | 10.4 | 9.0 | 9.0 | 8.6 | 10.7 | 10.9 | 11.1 | 119.1 |
| Source: Météo-France[3] | |||||||||||||
Population
| Year | Pop. | ±% p.a. |
|---|---|---|
| 1968 | 2,031 | — |
| 1975 | 2,308 | +1.84% |
| 1982 | 2,580 | +1.60% |
| 1990 | 2,801 | +1.03% |
| 1999 | 3,931 | +3.84% |
| 2009 | 5,073 | +2.58% |
| 2014 | 5,229 | +0.61% |
| 2020 | 5,609 | +1.18% |
| Source: INSEE[4] | ||
See also
References
- ^ "Répertoire national des élus: les maires" (in French). data.gouv.fr, Plateforme ouverte des données publiques françaises. 13 September 2022.
- ^ "Populations de référence 2022" (in French). The National Institute of Statistics and Economic Studies. 19 December 2024.
- ^ "Fiche Climatologique Statistiques 1991-2020 et records" (PDF) (in French). Météo-France. Retrieved September 4, 2022.
- ^ Population en historique depuis 1968, INSEE
External links