Chengwu County
Chengwu County
成武县 | |
|---|---|
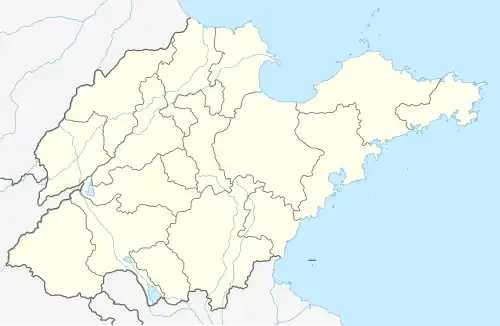 Chengwu Location of the seat in Shandong | |
| Coordinates: 34°57′N 115°53′E / 34.950°N 115.883°E | |
| Country | People's Republic of China |
| Province | Shandong |
| Prefecture-level city | Heze |
| Area | |
• Total | 998 km2 (385 sq mi) |
| Elevation | 46 m (151 ft) |
| Population (2019)[1] | |
• Total | 643,700 |
| • Density | 640/km2 (1,700/sq mi) |
| Time zone | UTC+8 (China Standard) |
| Postal Code | 274200 |
Chengwu County (simplified Chinese: 成武县; traditional Chinese: 成武縣; pinyin: Chéngwǔ Xiàn) is a county of southwestern Shandong province, People's Republic of China. It is under the administration of Heze city.
The population in 1999 was 622,871.[2]
Administrative divisions
As of 2012, this County is divided to 10 towns and 2 townships.[3]
- Towns
|
|
- Townships
- Dangji Township (党集乡)
- Zhanglou Township (张楼乡)
Climate
| Climate data for Chengwu, elevation 45 m (148 ft), (1991–2020 normals, extremes 1981–2010) | |||||||||||||
|---|---|---|---|---|---|---|---|---|---|---|---|---|---|
| Month | Jan | Feb | Mar | Apr | May | Jun | Jul | Aug | Sep | Oct | Nov | Dec | Year |
| Record high °C (°F) | 16.8 (62.2) |
25.3 (77.5) |
28.2 (82.8) |
32.7 (90.9) |
38.5 (101.3) |
40.0 (104.0) |
41.5 (106.7) |
38.8 (101.8) |
36.6 (97.9) |
32.7 (90.9) |
27.6 (81.7) |
20.3 (68.5) |
41.5 (106.7) |
| Mean daily maximum °C (°F) | 5.0 (41.0) |
9.1 (48.4) |
15.3 (59.5) |
21.7 (71.1) |
27.0 (80.6) |
31.7 (89.1) |
32.1 (89.8) |
30.8 (87.4) |
27.2 (81.0) |
21.8 (71.2) |
13.9 (57.0) |
7.0 (44.6) |
20.2 (68.4) |
| Daily mean °C (°F) | 0.3 (32.5) |
3.8 (38.8) |
9.5 (49.1) |
15.7 (60.3) |
21.2 (70.2) |
25.9 (78.6) |
27.4 (81.3) |
26.2 (79.2) |
21.9 (71.4) |
15.9 (60.6) |
8.4 (47.1) |
2.1 (35.8) |
14.9 (58.7) |
| Mean daily minimum °C (°F) | −3.2 (26.2) |
−0.1 (31.8) |
4.9 (40.8) |
10.4 (50.7) |
16.0 (60.8) |
20.8 (69.4) |
23.6 (74.5) |
22.7 (72.9) |
17.8 (64.0) |
11.5 (52.7) |
4.4 (39.9) |
−1.4 (29.5) |
10.6 (51.1) |
| Record low °C (°F) | −16.0 (3.2) |
−14.0 (6.8) |
−8.9 (16.0) |
−2.7 (27.1) |
3.9 (39.0) |
11.4 (52.5) |
17.0 (62.6) |
12.3 (54.1) |
6.0 (42.8) |
−2.0 (28.4) |
−12.6 (9.3) |
−16.7 (1.9) |
−16.7 (1.9) |
| Average precipitation mm (inches) | 12.0 (0.47) |
16.2 (0.64) |
17.3 (0.68) |
34.0 (1.34) |
52.1 (2.05) |
73.9 (2.91) |
180.0 (7.09) |
156.9 (6.18) |
75.6 (2.98) |
31.4 (1.24) |
29.5 (1.16) |
11.5 (0.45) |
690.4 (27.19) |
| Average precipitation days (≥ 0.1 mm) | 3.6 | 4.4 | 3.9 | 5.1 | 6.3 | 7.1 | 11.8 | 10.2 | 8.2 | 5.2 | 5.3 | 3.6 | 74.7 |
| Average snowy days | 3.3 | 2.7 | 0.6 | 0.1 | 0 | 0 | 0 | 0 | 0 | 0 | 0.9 | 1.6 | 9.2 |
| Average relative humidity (%) | 65 | 61 | 58 | 62 | 65 | 64 | 78 | 82 | 76 | 69 | 68 | 66 | 68 |
| Mean monthly sunshine hours | 125.6 | 129.0 | 177.0 | 204.0 | 210.6 | 187.7 | 168.5 | 158.2 | 151.3 | 146.9 | 136.1 | 128.5 | 1,923.4 |
| Percentage possible sunshine | 40 | 41 | 47 | 52 | 48 | 43 | 38 | 38 | 41 | 42 | 44 | 42 | 43 |
| Source: China Meteorological Administration[4][5] | |||||||||||||
References
- ^ a b 最新人口信息 (in Chinese). hongheiku. Retrieved 2021-01-12.
- ^ National Population Statistics Materials by County and City - 1999 Period, i China County & City Population 1999, Harvard China Historical GIS
- ^ "济宁市-行政区划网" (in Chinese). XZQH. Retrieved 2012-05-24.
- ^ 中国气象数据网 – WeatherBk Data (in Simplified Chinese). China Meteorological Administration. Retrieved 12 August 2023.
- ^ "Experience Template" 中国气象数据网 (in Simplified Chinese). China Meteorological Administration. Retrieved 12 August 2023.
External links