Chita, Boyacá
Chita | |
|---|---|
Municipality and town | |
 | |
.svg.png) Flag  Seal | |
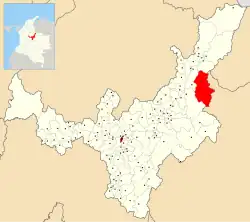 Location of the municipality and town of Chita in the Boyacá Department of Colombia. | |
| Country | |
| Department | Boyacá Department |
| Province | Valderrama Province |
| Government | |
| • Mayor | José Miguel Velandia Alarcón (2020-2023) |
| Time zone | UTC-5 (Colombia Standard Time) |
Chita is a town and municipality in the Colombian Department of Boyacá, part of the Valderrama Province a subregion of Boyaca in Colombia.
Climate
Chita has a subtropical highland climate (Köppen: Cfb)[1] with frequent rain and cool mild temperatures.
| Climate data for Chita, elevation 2,888 m (9,475 ft), (1981–2010) | |||||||||||||
|---|---|---|---|---|---|---|---|---|---|---|---|---|---|
| Month | Jan | Feb | Mar | Apr | May | Jun | Jul | Aug | Sep | Oct | Nov | Dec | Year |
| Mean daily maximum °C (°F) | 18.4 (65.1) |
18.6 (65.5) |
18.7 (65.7) |
17.8 (64.0) |
17.1 (62.8) |
16.1 (61.0) |
15.4 (59.7) |
15.7 (60.3) |
16.4 (61.5) |
17.0 (62.6) |
17.2 (63.0) |
17.9 (64.2) |
17.2 (63.0) |
| Daily mean °C (°F) | 11.6 (52.9) |
12.0 (53.6) |
12.4 (54.3) |
12.5 (54.5) |
12.2 (54.0) |
11.6 (52.9) |
11.1 (52.0) |
11.3 (52.3) |
11.5 (52.7) |
11.8 (53.2) |
11.9 (53.4) |
11.7 (53.1) |
11.8 (53.2) |
| Mean daily minimum °C (°F) | 5.2 (41.4) |
5.8 (42.4) |
6.7 (44.1) |
7.5 (45.5) |
7.8 (46.0) |
7.5 (45.5) |
7.1 (44.8) |
7.0 (44.6) |
6.7 (44.1) |
6.8 (44.2) |
6.7 (44.1) |
5.7 (42.3) |
6.7 (44.1) |
| Average precipitation mm (inches) | 15.0 (0.59) |
25.1 (0.99) |
48.5 (1.91) |
109.3 (4.30) |
119.6 (4.71) |
114.6 (4.51) |
160.0 (6.30) |
123.8 (4.87) |
93.0 (3.66) |
107.5 (4.23) |
97.8 (3.85) |
34.6 (1.36) |
1,048.7 (41.29) |
| Average precipitation days (≥ 1.0 mm) | 5 | 7 | 11 | 17 | 20 | 23 | 25 | 24 | 21 | 20 | 16 | 9 | 196 |
| Average relative humidity (%) | 72 | 71 | 73 | 77 | 79 | 79 | 80 | 79 | 78 | 79 | 81 | 77 | 77 |
| Mean monthly sunshine hours | 244.9 | 200.4 | 179.8 | 126.0 | 114.7 | 105.0 | 105.4 | 114.7 | 126.0 | 136.4 | 153.0 | 217.0 | 1,823.3 |
| Mean daily sunshine hours | 7.9 | 7.1 | 5.8 | 4.2 | 3.7 | 3.5 | 3.4 | 3.7 | 4.2 | 4.4 | 5.1 | 7.0 | 5.0 |
| Source: Instituto de Hidrologia Meteorologia y Estudios Ambientales[2] | |||||||||||||
References
- ^ "Table 1 Overview of the Köppen-Geiger climate classes including the defining criteria". Nature: Scientific Data. 23 October 2023.
- ^ "Promedios Climatológicos 1981–2010" (in Spanish). Instituto de Hidrologia Meteorologia y Estudios Ambientales. Archived from the original on 15 August 2016. Retrieved 3 June 2024.