Ciénaga de Oro
Cienaga de oro | |
|---|---|
Municipality and town | |
 Flag | |
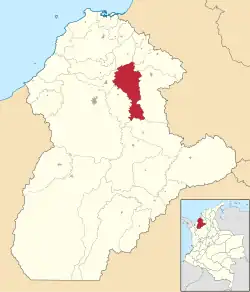 Location in the Department of Cordoba. | |
| Coordinates: 8°53′N 75°37′W / 8.883°N 75.617°W | |
| Country | Colombia |
| Region | Caribbean |
| Department | Cordoba |
| Foundation | December 15, 1776 |
| Government | |
| • Mayor | Alejandro Mejía |
| Area | |
• Municipality and town | 641.2 km2 (247.6 sq mi) |
| • Urban | 3.19 km2 (1.23 sq mi) |
| Elevation | 13 m (43 ft) |
| Population | |
• Municipality and town | 60,521 |
| • Density | 94/km2 (240/sq mi) |
| • Urban | 22,365 |
| • Urban density | 7,000/km2 (18,000/sq mi) |
| Time zone | UTC-5 |
| Website | cienagadeoro |
Ciénaga de Oro (Spanish pronunciation: [ˈsjenaɣa ðe oɾo]) meaning "Golden Marsh", is a town and municipality located in the Córdoba Department, northern Colombia.
According to 2020 estimates, the population of Ciénaga de Oro was 60,521, with a population density of 94 persons per square kilometer.
Ciénaga de Oro is the birthplace of Colombian president Gustavo Petro.
Climate
| Climate data for Ciénaga de Oro (Salado El), elevation 40 m (130 ft), (1981–2010) | |||||||||||||
|---|---|---|---|---|---|---|---|---|---|---|---|---|---|
| Month | Jan | Feb | Mar | Apr | May | Jun | Jul | Aug | Sep | Oct | Nov | Dec | Year |
| Mean daily maximum °C (°F) | 34.5 (94.1) |
34.9 (94.8) |
34.9 (94.8) |
34.4 (93.9) |
32.9 (91.2) |
32.8 (91.0) |
33.1 (91.6) |
32.9 (91.2) |
32.6 (90.7) |
32.6 (90.7) |
32.9 (91.2) |
33.6 (92.5) |
33.5 (92.3) |
| Daily mean °C (°F) | 28.0 (82.4) |
28.3 (82.9) |
28.4 (83.1) |
28.4 (83.1) |
28.0 (82.4) |
27.9 (82.2) |
27.9 (82.2) |
27.8 (82.0) |
27.6 (81.7) |
27.5 (81.5) |
27.8 (82.0) |
27.9 (82.2) |
28.0 (82.4) |
| Mean daily minimum °C (°F) | 23.1 (73.6) |
23.4 (74.1) |
24.0 (75.2) |
24.4 (75.9) |
24.2 (75.6) |
23.8 (74.8) |
23.6 (74.5) |
23.5 (74.3) |
23.4 (74.1) |
23.5 (74.3) |
23.6 (74.5) |
23.4 (74.1) |
23.6 (74.5) |
| Average precipitation mm (inches) | 16.4 (0.65) |
21.6 (0.85) |
27.0 (1.06) |
109.2 (4.30) |
188.8 (7.43) |
154.7 (6.09) |
167.5 (6.59) |
191.6 (7.54) |
192.6 (7.58) |
149.3 (5.88) |
107.6 (4.24) |
43.7 (1.72) |
1,369.9 (53.93) |
| Average precipitation days | 3 | 4 | 5 | 11 | 16 | 15 | 15 | 16 | 16 | 15 | 11 | 5 | 130 |
| Average relative humidity (%) | 84 | 82 | 81 | 81 | 85 | 86 | 85 | 85 | 86 | 86 | 86 | 85 | 84 |
| Source: Instituto de Hidrologia Meteorologia y Estudios Ambientales[3] | |||||||||||||
References
- ^ "Resultados y proyecciones (2005-2020) del censo 2005". Retrieved 12 April 2020.
- ^ Citypopulation.de
- ^ "Promedios Climatológicos 1981–2010" (in Spanish). Instituto de Hidrologia Meteorologia y Estudios Ambientales. Archived from the original on 15 August 2016. Retrieved 17 June 2024.