Cisa Pass
| Cisa Pass | |
|---|---|
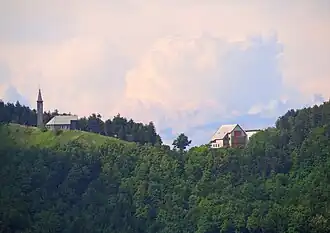 The Cisa Pass seen from the south | |
| Elevation | 1,041 m (3,415 ft) |
| Traversed by | |
| Location | Italy |
| Range | Apennine Mountains |
| Coordinates | 44°28′18″N 9°55′42″E / 44.4716°N 9.9283°E |
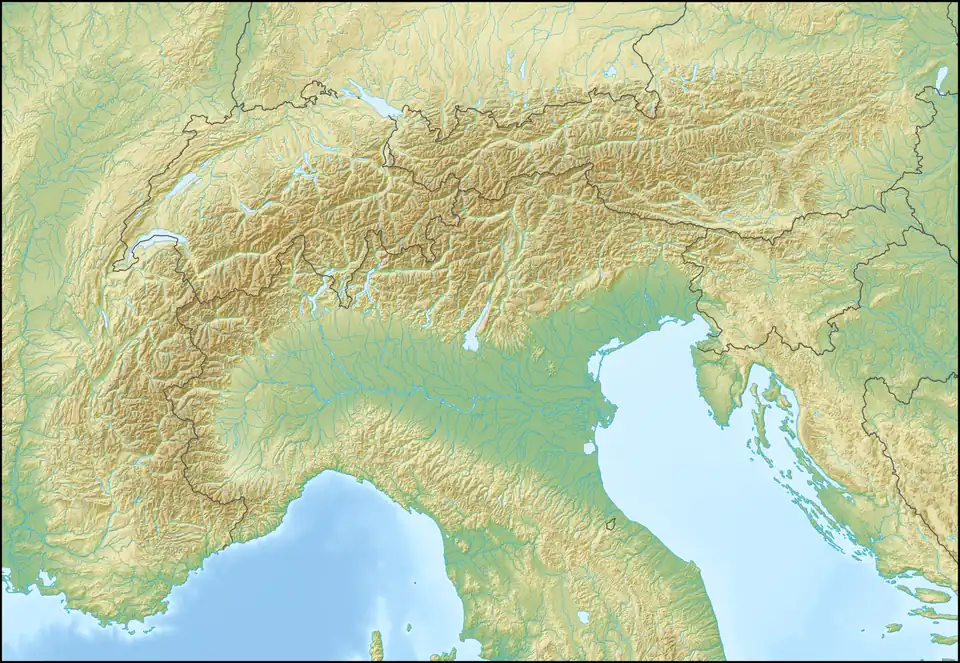 Cisa Pass Location of Cisa Pass | |
The Cisa Pass or La Cisa Pass is a mountain pass in Italy that marks the division between the Ligurian and Tuscan Apennines. It is located on the border between northern Tuscany (Province of Massa-Carrara) and Emilia-Romagna (Province of Parma), near the source of the Magra River at an altitude of 1,040 meters (3,414 feet) above sea level.[1]
Climate
Cisa's climate is classified as warm-summer mediterranean climate (Köppen: Csb). The annual average temperature is 8.3 °C (46.9 °F), the hottest month in July is 17.8 °C (64.0 °F), and the coldest month is 0.4 °C (32.7 °F) in February. The annual precipitation is 1,428.5 millimetres (56.24 in), of which October is the wettest with 202.3 millimetres (7.96 in), while July is the driest with only 42.4 millimetres (1.67 in).
| Climate data for Passo Della Cisa, elevation: 1,039 m or 3,409 ft, 1981-2010 normals, extremes 1924–2018 | |||||||||||||
|---|---|---|---|---|---|---|---|---|---|---|---|---|---|
| Month | Jan | Feb | Mar | Apr | May | Jun | Jul | Aug | Sep | Oct | Nov | Dec | Year |
| Record high °C (°F) | 15.0 (59.0) |
15.0 (59.0) |
18.4 (65.1) |
22.3 (72.1) |
25.8 (78.4) |
29.5 (85.1) |
31.8 (89.2) |
32.6 (90.7) |
27.4 (81.3) |
22.0 (71.6) |
18.0 (64.4) |
15.4 (59.7) |
32.6 (90.7) |
| Mean daily maximum °C (°F) | 2.5 (36.5) |
2.6 (36.7) |
6.0 (42.8) |
9.2 (48.6) |
14.4 (57.9) |
18.0 (64.4) |
21.2 (70.2) |
20.8 (69.4) |
15.7 (60.3) |
11.1 (52.0) |
6.0 (42.8) |
3.5 (38.3) |
10.9 (51.6) |
| Daily mean °C (°F) | 0.4 (32.7) |
0.4 (32.7) |
3.4 (38.1) |
6.4 (43.5) |
11.2 (52.2) |
14.7 (58.5) |
17.8 (64.0) |
17.6 (63.7) |
13.1 (55.6) |
9.1 (48.4) |
4.2 (39.6) |
1.4 (34.5) |
8.3 (46.9) |
| Mean daily minimum °C (°F) | −1.8 (28.8) |
−1.9 (28.6) |
0.8 (33.4) |
3.6 (38.5) |
8.1 (46.6) |
11.5 (52.7) |
14.3 (57.7) |
14.4 (57.9) |
10.4 (50.7) |
7.1 (44.8) |
2.4 (36.3) |
−0.8 (30.6) |
5.7 (42.3) |
| Record low °C (°F) | −18.8 (−1.8) |
−18.0 (−0.4) |
−15.4 (4.3) |
−6.0 (21.2) |
−4.4 (24.1) |
1.7 (35.1) |
4.0 (39.2) |
5.0 (41.0) |
1.6 (34.9) |
−5.8 (21.6) |
−10.3 (13.5) |
−13.0 (8.6) |
−18.8 (−1.8) |
| Average precipitation mm (inches) | 122.8 (4.83) |
85.3 (3.36) |
100.1 (3.94) |
167.3 (6.59) |
106.6 (4.20) |
84.5 (3.33) |
42.4 (1.67) |
58.8 (2.31) |
120.7 (4.75) |
202.3 (7.96) |
200.7 (7.90) |
137.0 (5.39) |
1,428.6 (56.24) |
| Average precipitation days (≥ 1.0 mm) | 8.8 | 7.0 | 8.5 | 11.2 | 9.2 | 7.6 | 5.2 | 5.7 | 8.1 | 10.9 | 10.4 | 8.7 | 101.2 |
| Average dew point °C (°F) | −3.0 (26.6) |
−3.3 (26.1) |
−0.6 (30.9) |
2.6 (36.7) |
7.0 (44.6) |
10.7 (51.3) |
12.8 (55.0) |
12.9 (55.2) |
8.8 (47.8) |
6.1 (43.0) |
1.6 (34.9) |
−1.7 (28.9) |
4.5 (40.1) |
| Mean monthly sunshine hours | 125.9 | 129.8 | 166.7 | 175.5 | 206.4 | 250.2 | 305.1 | 270.5 | 201.6 | 164.8 | 122.3 | 114.0 | 2,232.9 |
| Source 1: NOAA[2] | |||||||||||||
| Source 2: Temperature estreme in Toscana[3] | |||||||||||||
See also
Notes
- ^ Webster's New Geographical Dictionary, Third Edition, p. 59
- ^ "WMO Climate Normals for 1981-2010: Passo Della Cisa - (WMO number:16124)". ncei.noaa.gov (Excel). National Oceanic and Atmosoheric Administration. Archived from the original (XLS) on 2024-03-17. Retrieved 1 March 2024.
{{cite web}}: CS1 maint: postscript (link) - ^ "Passo della Cisa" (in Italian). Temperature estreme in Toscana. Archived from the original on 2024-03-18. Retrieved March 18, 2024.
References
- Webster's New Geographical Dictionary, Third Edition. Springfield, Massachusetts: Merriam-Webster, Inc., 1997. ISBN 0-87779-546-0.