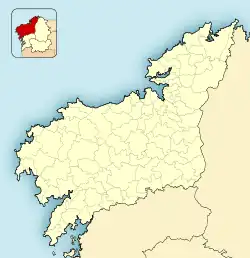
Culleredo
Culleredo | |
|---|---|
 | |
 Flag  Coat of arms | |
| Nickname: Culleredo | |
 Culleredo 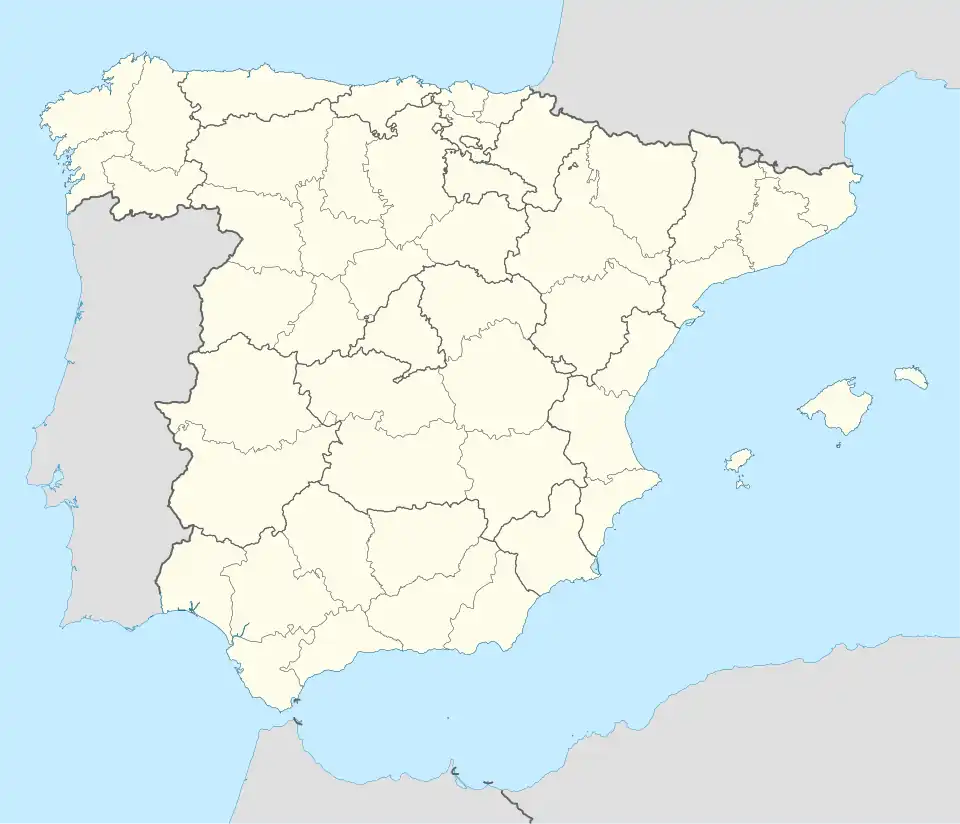 Culleredo | |
| Coordinates: 43°17′18″N 8°23′22″W / 43.28833°N 8.38944°W | |
| Country | |
| Autonomous community | |
| Province | A Coruña |
| Parroquia | 11 |
| Government | |
| • Alcalde (Mayor) | Julio Sacristán de Diego (PSdeG-PSOE) |
| Area | |
• Total | 63 km2 (24 sq mi) |
| Population (2018)[1] | |
• Total | 30,221 |
| • Density | 480/km2 (1,200/sq mi) |
| Time zone | UTC+1 (CET) |
| • Summer (DST) | UTC+2 (CEST) |
Culleredo (Spanish pronunciation: [kuʎeˈɾeðo], Galician: [kuɟeˈɾeðʊ]) is a municipality in the province of A Coruña, in the autonomous community of Galicia, northwestern Spain. Culleredo is located on the outskirts of A Coruña and its population is mainly formed of commuters. It is located in the central area of the province. It belongs to the comarca of A Coruña in the extreme south of the Burgo river. The population of Culleredo works in the service sector, and there is little industry and agriculture. The airport of A Coruña, or Alvedro, is also located in Culleredo.

Climate
Culleredo has a climate that is transitional between the mediterranean (Csb) and oceanic climates (Cfb) due to a sizeable summer drying trend that sits on the threshold between the two classifications. Culleredo is somewhat more prone to extremes than urban A Coruña, but is still heavily influenced by the warm Atlantic sea air in winter and mildened by the same air in summer, that renders the climate very mild for its latitude.
| Climate data for A Coruña Airport (1991–2020 normals), 98 m asl, extremes since 1971 | |||||||||||||
|---|---|---|---|---|---|---|---|---|---|---|---|---|---|
| Month | Jan | Feb | Mar | Apr | May | Jun | Jul | Aug | Sep | Oct | Nov | Dec | Year |
| Record high °C (°F) | 22.3 (72.1) |
24.3 (75.7) |
28.0 (82.4) |
33.1 (91.6) |
33.6 (92.5) |
37.2 (99.0) |
36.0 (96.8) |
37.7 (99.9) |
35.9 (96.6) |
33.7 (92.7) |
26.0 (78.8) |
25.4 (77.7) |
37.7 (99.9) |
| Mean daily maximum °C (°F) | 13.2 (55.8) |
14.0 (57.2) |
15.9 (60.6) |
16.9 (62.4) |
19.2 (66.6) |
21.5 (70.7) |
23.2 (73.8) |
23.8 (74.8) |
22.6 (72.7) |
19.6 (67.3) |
15.6 (60.1) |
13.9 (57.0) |
18.3 (64.9) |
| Daily mean °C (°F) | 9.6 (49.3) |
9.8 (49.6) |
11.4 (52.5) |
12.5 (54.5) |
14.8 (58.6) |
17.2 (63.0) |
18.9 (66.0) |
19.3 (66.7) |
17.9 (64.2) |
15.3 (59.5) |
12.0 (53.6) |
10.2 (50.4) |
14.1 (57.4) |
| Mean daily minimum °C (°F) | 5.9 (42.6) |
5.5 (41.9) |
6.9 (44.4) |
8.0 (46.4) |
10.4 (50.7) |
12.9 (55.2) |
14.7 (58.5) |
14.8 (58.6) |
13.2 (55.8) |
11.0 (51.8) |
8.2 (46.8) |
6.5 (43.7) |
9.9 (49.8) |
| Record low °C (°F) | −4.8 (23.4) |
−4.3 (24.3) |
−3.3 (26.1) |
−1.0 (30.2) |
0.6 (33.1) |
3.4 (38.1) |
5.8 (42.4) |
5.2 (41.4) |
3.0 (37.4) |
0.6 (33.1) |
−4.0 (24.8) |
−4.7 (23.5) |
−4.8 (23.4) |
| Average precipitation mm (inches) | 115.9 (4.56) |
91.2 (3.59) |
92.4 (3.64) |
93.6 (3.69) |
73.4 (2.89) |
48.6 (1.91) |
33.6 (1.32) |
40.5 (1.59) |
62.0 (2.44) |
129.3 (5.09) |
159.4 (6.28) |
134.4 (5.29) |
1,074.3 (42.29) |
| Average precipitation days (≥ 1 mm) | 13.8 | 11.1 | 12.1 | 12.8 | 10.3 | 6.7 | 5.7 | 6.1 | 8.2 | 12.9 | 15.7 | 14.6 | 130 |
| Mean monthly sunshine hours | 96 | 124 | 159 | 180 | 206 | 215 | 244 | 248 | 192 | 150 | 103 | 91 | 2,008 |
| Source: Météo Climat[2] | |||||||||||||
| Climate data for A Coruña Airport (1981-2010 normals), 98 m asl | |||||||||||||
|---|---|---|---|---|---|---|---|---|---|---|---|---|---|
| Month | Jan | Feb | Mar | Apr | May | Jun | Jul | Aug | Sep | Oct | Nov | Dec | Year |
| Record high °C (°F) | 22.1 (71.8) |
23.4 (74.1) |
28.0 (82.4) |
33.1 (91.6) |
32.5 (90.5) |
37.2 (99.0) |
36.0 (96.8) |
37.7 (99.9) |
34.4 (93.9) |
33.7 (92.7) |
26.0 (78.8) |
25.4 (77.7) |
37.7 (99.9) |
| Mean daily maximum °C (°F) | 13.1 (55.6) |
13.8 (56.8) |
15.7 (60.3) |
16.5 (61.7) |
18.6 (65.5) |
21.4 (70.5) |
23.1 (73.6) |
23.7 (74.7) |
22.6 (72.7) |
19.2 (66.6) |
15.7 (60.3) |
13.7 (56.7) |
18.1 (64.6) |
| Daily mean °C (°F) | 9.3 (48.7) |
9.5 (49.1) |
11.1 (52.0) |
12.1 (53.8) |
14.4 (57.9) |
17.1 (62.8) |
18.7 (65.7) |
19.1 (66.4) |
17.7 (63.9) |
14.9 (58.8) |
11.8 (53.2) |
9.9 (49.8) |
13.8 (56.8) |
| Mean daily minimum °C (°F) | 5.4 (41.7) |
5.2 (41.4) |
6.6 (43.9) |
7.7 (45.9) |
10.1 (50.2) |
12.7 (54.9) |
14.3 (57.7) |
14.5 (58.1) |
12.9 (55.2) |
10.6 (51.1) |
7.9 (46.2) |
6.1 (43.0) |
9.5 (49.1) |
| Record low °C (°F) | −4.8 (23.4) |
−4.3 (24.3) |
−3.3 (26.1) |
−1.0 (30.2) |
0.6 (33.1) |
3.4 (38.1) |
5.8 (42.4) |
5.2 (41.4) |
3.0 (37.4) |
0.6 (33.1) |
−4.0 (24.8) |
−4.7 (23.5) |
−4.8 (23.4) |
| Average precipitation mm (inches) | 121 (4.8) |
102 (4.0) |
85 (3.3) |
99 (3.9) |
82 (3.2) |
45 (1.8) |
35 (1.4) |
36 (1.4) |
72 (2.8) |
139 (5.5) |
140 (5.5) |
144 (5.7) |
1,106 (43.5) |
| Average precipitation days (≥ 1 mm) | 13.6 | 12.0 | 11.6 | 13.5 | 11.8 | 6.7 | 5.6 | 5.9 | 8.2 | 13.3 | 13.9 | 14.6 | 130.7 |
| Average snowy days | 0.2 | 0 | 0 | 0 | 0 | 0 | 0 | 0 | 0 | 0 | 0 | 0 | 0.2 |
| Average relative humidity (%) | 77 | 74 | 71 | 72 | 73 | 73 | 74 | 74 | 75 | 78 | 79 | 78 | 75 |
| Mean monthly sunshine hours | 99 | 117 | 155 | 173 | 194 | 217 | 236 | 240 | 181 | 142 | 104 | 94 | 1,939 |
| Source 1: Agencia Estatal de Meteorología[3] | |||||||||||||
| Source 2: Agencia Estatal de Meteorología[4] | |||||||||||||
See also
List of municipalities in A Coruña
References
- ^ Municipal Register of Spain 2018. National Statistics Institute.
- ^ "Météo climat stats Moyennes 1991/2020 Espagne (page 1)" (in French). Retrieved 14 June 2022.
- ^ "Standard climate values for A Coruña Aeropuerto". AEMET.es. Retrieved 2 November 2017.
- ^ "Extreme values for A Coruña Aeropuerto". AEMET.es. Retrieved 2 November 2017.
External links