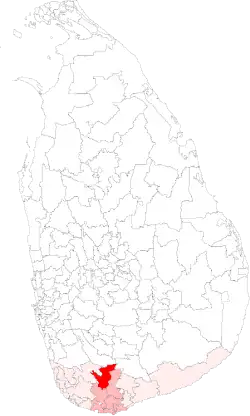
The Deniyaya Polling Division is a Polling Division in the Matara Electoral District, in the Southern Province, Sri Lanka.
Presidential Election Results
Summary
The winner of Deniyaya has matched the final country result 6 out of 8 times. Hence, Deniyaya is a Weak Bellwether for Presidential Elections.
| Party
|
Deniyaya[4]
|
Matara Electoral District
|
Sri Lanka
|
| Votes
|
%
|
Votes
|
%
|
Votes
|
%
|
|
|
SLPP
|
|
54,472
|
64.04%
|
|
374,481
|
67.25%
|
|
6,924,255
|
52.25%
|
|
|
NDF
|
|
25,763
|
30.29%
|
|
149,026
|
26.76%
|
|
5,564,239
|
41.99%
|
|
|
NMPP
|
|
2,786
|
3.28%
|
|
23,439
|
4.21%
|
|
418,553
|
3.16%
|
|
|
Other Parties (with < 1%)
|
|
2,041
|
2.40%
|
|
9,922
|
1.78%
|
|
345,452
|
2.61%
|
| Valid Votes
|
85,062
|
99.15%
|
556,868
|
99.33%
|
13,252,499
|
98.99%
|
| Rejected Votes
|
731
|
0.85%
|
3,782
|
0.67%
|
135,452
|
1.01%
|
| Total Polled
|
85,793
|
85.57%
|
560,650
|
85.93%
|
13,387,951
|
83.71%
|
| Registered Electors
|
100,264
|
|
652,417
|
|
15,992,568
|
|
| Party
|
Deniyaya[5]
|
Matara Electoral District
|
Sri Lanka
|
| Votes
|
%
|
Votes
|
%
|
Votes
|
%
|
|
|
UPFA
|
|
44,273
|
57.39%
|
|
297,823
|
57.81%
|
|
5,768,090
|
47.58%
|
|
|
NDF
|
|
31,716
|
41.12%
|
|
212,435
|
41.24%
|
|
6,217,162
|
51.28%
|
|
|
Other Parties (with < 1%)
|
|
1,149
|
1.49%
|
|
4,892
|
0.95%
|
|
138,200
|
1.14%
|
| Valid Votes
|
77,138
|
98.73%
|
515,150
|
99.06%
|
12,123,452
|
98.85%
|
| Rejected Votes
|
990
|
1.27%
|
4,891
|
0.94%
|
140,925
|
1.15%
|
| Total Polled
|
78,128
|
80.04%
|
520,041
|
80.23%
|
12,264,377
|
78.69%
|
| Registered Electors
|
97,610
|
|
648,213
|
|
15,585,942
|
|
| Party
|
Deniyaya[6]
|
Matara Electoral District
|
Sri Lanka
|
| Votes
|
%
|
Votes
|
%
|
Votes
|
%
|
|
|
UPFA
|
|
42,999
|
65.53%
|
|
296,155
|
65.53%
|
|
6,015,934
|
57.88%
|
|
|
NDF
|
|
20,939
|
31.91%
|
|
148,510
|
32.86%
|
|
4,173,185
|
40.15%
|
|
|
Other Parties (with < 1%)
|
|
1,675
|
2.55%
|
|
7,264
|
1.61%
|
|
204,494
|
1.97%
|
| Valid Votes
|
65,613
|
99.06%
|
451,929
|
99.34%
|
10,393,613
|
99.03%
|
| Rejected Votes
|
624
|
0.94%
|
3,025
|
0.66%
|
101,838
|
0.97%
|
| Total Polled
|
66,237
|
76.74%
|
454,954
|
76.51%
|
10,495,451
|
66.70%
|
| Registered Electors
|
86,311
|
|
594,628
|
|
15,734,587
|
|
| Party
|
Deniyaya[7]
|
Matara Electoral District
|
Sri Lanka
|
| Votes
|
%
|
Votes
|
%
|
Votes
|
%
|
|
|
UPFA
|
|
36,916
|
55.79%
|
|
279,411
|
61.85%
|
|
4,887,152
|
50.29%
|
|
|
UNP
|
|
28,015
|
42.34%
|
|
165,837
|
36.71%
|
|
4,706,366
|
48.43%
|
|
|
Other Parties (with < 1%)
|
|
1,242
|
1.88%
|
|
6,474
|
1.43%
|
|
123,521
|
1.27%
|
| Valid Votes
|
66,173
|
98.69%
|
451,722
|
99.11%
|
9,717,039
|
98.88%
|
| Rejected Votes
|
879
|
1.31%
|
4,077
|
0.89%
|
109,869
|
1.12%
|
| Total Polled
|
67,052
|
81.14%
|
455,799
|
78.95%
|
9,826,908
|
69.51%
|
| Registered Electors
|
82,636
|
|
577,327
|
|
14,136,979
|
|
| Party
|
Deniyaya[8]
|
Matara Electoral District
|
Sri Lanka
|
| Votes
|
%
|
Votes
|
%
|
Votes
|
%
|
|
|
PA
|
|
29,229
|
53.09%
|
|
205,685
|
54.32%
|
|
4,312,157
|
51.12%
|
|
|
UNP
|
|
21,400
|
38.87%
|
|
139,677
|
36.89%
|
|
3,602,748
|
42.71%
|
|
|
JVP
|
|
3,108
|
5.65%
|
|
26,229
|
6.93%
|
|
343,927
|
4.08%
|
|
|
Other Parties (with < 1%)
|
|
1,318
|
2.39%
|
|
7,047
|
1.86%
|
|
176,679
|
2.09%
|
| Valid Votes
|
55,055
|
97.41%
|
378,638
|
97.78%
|
8,435,754
|
97.69%
|
| Rejected Votes
|
1,464
|
2.59%
|
8,583
|
2.22%
|
199,536
|
2.31%
|
| Total Polled
|
56,519
|
75.96%
|
387,221
|
73.90%
|
8,635,290
|
72.17%
|
| Registered Electors
|
74,409
|
|
524,002
|
|
11,965,536
|
|
| Party
|
Deniyaya[9]
|
Matara Electoral District
|
Sri Lanka
|
| Votes
|
%
|
Votes
|
%
|
Votes
|
%
|
|
|
PA
|
|
30,662
|
60.40%
|
|
227,865
|
64.69%
|
|
4,709,205
|
62.28%
|
|
|
UNP
|
|
18,819
|
37.07%
|
|
118,224
|
33.56%
|
|
2,715,283
|
35.91%
|
|
|
Other Parties (with < 1%)
|
|
1,284
|
2.53%
|
|
6,150
|
1.75%
|
|
137,040
|
1.81%
|
| Valid Votes
|
50,765
|
97.52%
|
352,239
|
98.40%
|
7,561,526
|
98.03%
|
| Rejected Votes
|
1,293
|
2.48%
|
5,731
|
1.60%
|
151,706
|
1.97%
|
| Total Polled
|
52,058
|
73.21%
|
357,970
|
69.93%
|
7,713,232
|
69.12%
|
| Registered Electors
|
71,106
|
|
511,933
|
|
11,158,880
|
|
| Party
|
Deniyaya[10]
|
Matara Electoral District
|
Sri Lanka
|
| Votes
|
%
|
Votes
|
%
|
Votes
|
%
|
|
|
SLFP
|
|
10,949
|
50.55%
|
|
57,424
|
54.30%
|
|
2,289,857
|
44.95%
|
|
|
UNP
|
|
10,157
|
46.89%
|
|
45,399
|
42.93%
|
|
2,569,199
|
50.43%
|
|
|
SLMP
|
|
554
|
2.56%
|
|
2,922
|
2.76%
|
|
235,701
|
4.63%
|
| Valid Votes
|
21,660
|
98.28%
|
105,745
|
98.14%
|
5,094,754
|
98.24%
|
| Rejected Votes
|
378
|
1.72%
|
2,003
|
1.86%
|
91,499
|
1.76%
|
| Total Polled
|
22,038
|
37.77%
|
107,748
|
23.80%
|
5,186,256
|
55.87%
|
| Registered Electors
|
58,342
|
|
452,637
|
|
9,283,143
|
|
| Party
|
Deniyaya[11]
|
Matara Electoral District
|
Sri Lanka
|
| Votes
|
%
|
Votes
|
%
|
Votes
|
%
|
|
|
UNP
|
|
22,457
|
52.41%
|
|
164,725
|
49.32%
|
|
3,450,815
|
52.93%
|
|
|
SLFP
|
|
18,147
|
42.36%
|
|
144,587
|
43.29%
|
|
2,546,348
|
39.05%
|
|
|
JVP
|
|
1,886
|
4.40%
|
|
22,117
|
6.62%
|
|
273,428
|
4.19%
|
|
|
Other Parties (with < 1%)
|
|
355
|
0.83%
|
|
2,554
|
0.76%
|
|
249,460
|
3.83%
|
| Valid Votes
|
42,845
|
99.01%
|
333,983
|
99.08%
|
6,520,156
|
98.78%
|
| Rejected Votes
|
428
|
0.99%
|
3,091
|
0.92%
|
80,470
|
1.22%
|
| Total Polled
|
43,273
|
86.86%
|
337,074
|
82.90%
|
6,600,626
|
80.15%
|
| Registered Electors
|
49,817
|
|
406,595
|
|
8,235,358
|
|
Parliamentary Election Results
Summary
The winner of Deniyaya has matched the final country result 6 out of 7 times. Hence, Deniyaya is a Strong Bellwether for Parliamentary Elections.
| Party
|
Deniyaya[14]
|
Matara Electoral District
|
Sri Lanka
|
| Votes
|
%
|
Votes
|
%
|
Votes
|
%
|
|
|
UPFA
|
|
36,532
|
51.49%
|
|
250,505
|
52.70%
|
|
4,732,664
|
42.48%
|
|
|
UNP
|
|
30,024
|
42.31%
|
|
186,675
|
39.27%
|
|
5,098,916
|
45.77%
|
|
|
JVP
|
|
4,070
|
5.74%
|
|
35,270
|
7.42%
|
|
544,154
|
4.88%
|
|
|
Other Parties (with < 1%)
|
|
328
|
0.46%
|
|
2,890
|
0.61%
|
|
62,184
|
0.56%
|
| Valid Votes
|
70,954
|
96.17%
|
475,340
|
96.93%
|
11,140,333
|
95.35%
|
| Rejected Votes
|
2,702
|
3.66%
|
12,692
|
2.59%
|
516,926
|
4.42%
|
| Total Polled
|
73,776
|
75.58%
|
490,409
|
78.61%
|
11,684,111
|
77.66%
|
| Registered Electors
|
97,610
|
|
623,818
|
|
15,044,490
|
|
| Party
|
Deniyaya[15]
|
Matara Electoral District
|
Sri Lanka
|
| Votes
|
%
|
Votes
|
%
|
Votes
|
%
|
|
|
UPFA
|
|
30,270
|
66.82%
|
|
213,937
|
65.31%
|
|
4,846,388
|
60.38%
|
|
|
UNP
|
|
12,737
|
28.12%
|
|
91,114
|
27.81%
|
|
2,357,057
|
29.37%
|
|
|
DNA
|
|
1,960
|
4.33%
|
|
20,465
|
6.25%
|
|
441,251
|
5.50%
|
|
|
Other Parties (with < 1%)
|
|
333
|
0.74%
|
|
2,066
|
0.63%
|
|
53,531
|
0.67%
|
| Valid Votes
|
45,300
|
94.34%
|
327,582
|
95.82%
|
8,026,322
|
96.03%
|
| Rejected Votes
|
2,718
|
5.66%
|
14,289
|
4.18%
|
581,465
|
6.96%
|
| Total Polled
|
48,018
|
55.63%
|
341,871
|
59.06%
|
8,358,246
|
59.29%
|
| Registered Electors
|
86,311
|
|
578,858
|
|
14,097,690
|
|
| Party
|
Deniyaya[16]
|
Matara Electoral District
|
Sri Lanka
|
| Votes
|
%
|
Votes
|
%
|
Votes
|
%
|
|
|
UPFA
|
|
33,051
|
56.79%
|
|
241,235
|
60.27%
|
|
4,223,126
|
45.70%
|
|
|
UNP
|
|
23,262
|
39.97%
|
|
139,633
|
34.89%
|
|
3,486,792
|
37.73%
|
|
|
JHU
|
|
1,197
|
2.06%
|
|
16,229
|
4.05%
|
|
552,723
|
5.98%
|
|
|
Other Parties (with < 1%)
|
|
692
|
1.19%
|
|
3,136
|
0.78%
|
|
54,133
|
0.59%
|
| Valid Votes
|
58,202
|
92.76%
|
400,233
|
94.62%
|
9,241,931
|
94.52%
|
| Rejected Votes
|
4,545
|
7.24%
|
22,769
|
5.38%
|
534,452
|
5.47%
|
| Total Polled
|
62,747
|
78.18%
|
423,002
|
76.84%
|
9,777,821
|
75.74%
|
| Registered Electors
|
80,259
|
|
550,506
|
|
12,909,631
|
|
| Party
|
Deniyaya[17]
|
Matara Electoral District
|
Sri Lanka
|
| Votes
|
%
|
Votes
|
%
|
Votes
|
%
|
|
|
UNP
|
|
26,114
|
44.70%
|
|
171,661
|
42.49%
|
|
4,086,026
|
45.62%
|
|
|
PA
|
|
24,399
|
41.76%
|
|
171,141
|
42.37%
|
|
3,330,815
|
37.19%
|
|
|
JVP
|
|
6,776
|
11.60%
|
|
54,476
|
13.49%
|
|
815,353
|
9.10%
|
|
|
Other Parties (with < 1%)
|
|
1,134
|
1.94%
|
|
6,689
|
1.66%
|
|
133,373
|
1.49%
|
| Valid Votes
|
58,423
|
93.55%
|
403,967
|
95.10%
|
8,955,844
|
94.77%
|
| Rejected Votes
|
4,030
|
6.45%
|
20,820
|
4.90%
|
494,009
|
5.23%
|
| Total Polled
|
62,453
|
80.54%
|
424,787
|
79.44%
|
9,449,878
|
76.03%
|
| Registered Electors
|
77,540
|
|
534,694
|
|
12,428,762
|
|
| Party
|
Deniyaya[18]
|
Matara Electoral District
|
Sri Lanka
|
| Votes
|
%
|
Votes
|
%
|
Votes
|
%
|
|
|
PA
|
|
29,427
|
50.80%
|
|
203,690
|
51.47%
|
|
3,899,329
|
45.33%
|
|
|
UNP
|
|
23,807
|
41.10%
|
|
146,855
|
37.11%
|
|
3,451,765
|
40.12%
|
|
|
JVP
|
|
3,986
|
6.88%
|
|
38,757
|
9.79%
|
|
518,725
|
6.03%
|
|
|
Other Parties (with < 1%)
|
|
710
|
1.23%
|
|
6,462
|
1.63%
|
|
238,931
|
2.78%
|
| Valid Votes
|
57,930
|
N/A
|
395,764
|
N/A
|
8,602,617
|
N/A
|
| Party
|
Deniyaya[19]
|
Matara Electoral District
|
Sri Lanka
|
| Votes
|
%
|
Votes
|
%
|
Votes
|
%
|
|
|
PA
|
|
30,743
|
55.29%
|
|
227,285
|
59.90%
|
|
3,887,805
|
48.94%
|
|
|
UNP
|
|
23,930
|
43.03%
|
|
142,024
|
37.43%
|
|
3,498,370
|
44.04%
|
|
|
SLPF
|
|
756
|
1.36%
|
|
8,736
|
2.30%
|
|
90,078
|
1.13%
|
|
|
Other Parties (with < 1%)
|
|
178
|
0.32%
|
|
1,422
|
0.37%
|
|
68,538
|
0.86%
|
| Valid Votes
|
55,607
|
94.35%
|
379,467
|
95.67%
|
7,943,688
|
95.20%
|
| Rejected Votes
|
3,330
|
5.65%
|
17,167
|
4.33%
|
400,395
|
4.80%
|
| Total Polled
|
58,937
|
82.89%
|
396,634
|
77.60%
|
8,344,095
|
74.75%
|
| Registered Electors
|
71,106
|
|
511,109
|
|
11,163,064
|
|
| Party
|
Deniyaya[20]
|
Matara Electoral District
|
Sri Lanka
|
| Votes
|
%
|
Votes
|
%
|
Votes
|
%
|
|
|
UNP
|
|
3,556
|
57.76%
|
|
45,734
|
56.11%
|
|
2,838,005
|
50.71%
|
|
|
SLFP
|
|
2,301
|
37.37%
|
|
28,752
|
35.28%
|
|
1,785,369
|
31.90%
|
|
|
MEP
|
|
105
|
1.71%
|
|
1,313
|
1.61%
|
|
90,480
|
1.62%
|
|
|
USA
|
|
104
|
1.69%
|
|
4,225
|
5.18%
|
|
141,983
|
2.54%
|
|
|
ELJP
|
|
91
|
1.48%
|
|
1,481
|
1.82%
|
|
67,723
|
1.21%
|
| Valid Votes
|
6,157
|
91.57%
|
81,505
|
94.08%
|
5,596,468
|
93.87%
|
| Rejected Votes
|
567
|
8.43%
|
5,128
|
5.92%
|
365,563
|
6.13%
|
| Total Polled
|
6,724
|
11.59%
|
86,633
|
19.17%
|
5,962,031
|
63.60%
|
| Registered Electors
|
58,008
|
|
451,926
|
|
9,374,164
|
|
Demographics
Ethnicity
The Deniyaya Polling Division has a Sinhalese majority (86.2%) . In comparison, the Matara Electoral District (which contains the Deniyaya Polling Division) has a Sinhalese majority (94.3%) [1]
Religion
The Deniyaya Polling Division has a Buddhist majority (86.3%) and a significant Hindu population (10.9%) . In comparison, the Matara Electoral District (which contains the Deniyaya Polling Division) has a Buddhist majority (94.1%) [1]
References