Duero, Bohol
Duero | |
|---|---|
| Municipality of Duero | |
 Duero | |
 Flag | |
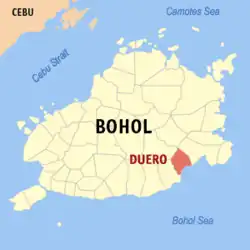 Map of Bohol with Duero highlighted | |
OpenStreetMap | |
.svg.png) Duero Location within the Philippines | |
| Coordinates: 9°43′N 124°24′E / 9.72°N 124.4°E | |
| Country | Philippines |
| Region | Central Visayas |
| Province | Bohol |
| District | 3rd district |
| Founded | 1862 |
| Barangays | 21 (see Barangays) |
| Government | |
| • Type | Sangguniang Bayan |
| • Mayor | Al Cadorniga Taculad |
| • Vice Mayor | Hernes Alupit Bajao |
| • Representative | Kristine Alexie B. Tutor |
| • Municipal Council | Members |
| • Electorate | 14,421 voters (2025) |
| Area | |
• Total | 97.30 km2 (37.57 sq mi) |
| Elevation | 152 m (499 ft) |
| Highest elevation | 789 m (2,589 ft) |
| Lowest elevation | 0 m (0 ft) |
| Population (2024 census)[4] | |
• Total | 19,136 |
| • Density | 200/km2 (510/sq mi) |
| • Households | 4,517 |
| Economy | |
| • Income class | 4th municipal income class |
| • Poverty incidence | 23.18 |
| • Revenue | ₱ 137.2 million (2022) |
| • Assets | ₱ 388.8 million (2022) |
| • Expenditure | ₱ 106.7 million (2022) |
| • Liabilities | ₱ 90.4 million (2022) |
| Service provider | |
| • Electricity | Bohol 2 Electric Cooperative (BOHECO 2) |
| Time zone | UTC+8 (PST) |
| ZIP code | 6309 |
| PSGC | |
| IDD : area code | +63 (0)38 |
| Native languages | Boholano dialect Cebuano Eskayan Tagalog |
| Website | duerobohol |
Duero, officially the Municipality of Duero (Cebuano: Munisipyo sa Duero; Tagalog: Bayan ng Duero), is a municipality in the province of Bohol, Philippines. According to the 2020 census, it has a population of 18,861 people.[6]
Duero is 77 kilometres (48 mi) from Tagbilaran.
Duero celebrates its fiesta on December 8, to honor the town patron Immaculate Conception.[7]
History
The town may have been named after the Douro (Duero) river in the Iberian Peninsula. Roman Catholicism was introduced to the town in 1860 by a Spanish priest. Duero was established as a municipality two years later, in 1862, and a convent was constructed in 1868.[8]
Geography
Barangays
Duero politically subdivided into 21 barangays. Each barangay consists of puroks and some have sitios.
| PSGC | Barangay | Population | ±% p.a. | |||
|---|---|---|---|---|---|---|
| 2024[9] | 2010[10] | |||||
| 071221001 | Alejawan | 4.0% | 773 | 801 | −0.25% | |
| 071221002 | Angilan | 2.7% | 514 | 540 | −0.34% | |
| 071221003 | Anibongan | 2.5% | 479 | 540 | −0.83% | |
| 071221004 | Bangwalog | 7.1% | 1,358 | 1,340 | 0.09% | |
| 071221005 | Cansuhay | 4.1% | 789 | 735 | 0.50% | |
| 071221006 | Danao | 3.4% | 646 | 688 | −0.44% | |
| 071221007 | Duay | 2.5% | 482 | 390 | 1.49% | |
| 071221008 | Guinsularan | 8.8% | 1,689 | 1,736 | −0.19% | |
| 071221020 | Imelda | 3.2% | 603 | 615 | −0.14% | |
| 071221009 | Itum | 5.9% | 1,135 | 1,139 | −0.02% | |
| 071221010 | Langkis | 7.0% | 1,338 | 1,002 | 2.04% | |
| 071221011 | Lobogon | 5.8% | 1,103 | 1,329 | −1.30% | |
| 071221012 | Madua Norte | 2.7% | 515 | 475 | 0.57% | |
| 071221013 | Madua Sur | 3.8% | 731 | 699 | 0.31% | |
| 071221014 | Mambool | 3.2% | 607 | 556 | 0.62% | |
| 071221015 | Mawi | 2.7% | 523 | 518 | 0.07% | |
| 071221016 | Payao | 3.3% | 639 | 598 | 0.46% | |
| 071221017 | San Antonio (Poblacion) | 6.2% | 1,181 | 1,211 | −0.18% | |
| 071221018 | San Isidro | 4.3% | 816 | 809 | 0.06% | |
| 071221019 | San Pedro | 7.7% | 1,467 | 1,334 | 0.67% | |
| 071221021 | Taytay | 3.2% | 611 | 525 | 1.07% | |
| Total | 19,136 | 17,580 | 0.59% | |||
Climate
| Climate data for Duero, Bohol | |||||||||||||
|---|---|---|---|---|---|---|---|---|---|---|---|---|---|
| Month | Jan | Feb | Mar | Apr | May | Jun | Jul | Aug | Sep | Oct | Nov | Dec | Year |
| Mean daily maximum °C (°F) | 28 (82) |
29 (84) |
30 (86) |
31 (88) |
31 (88) |
30 (86) |
30 (86) |
30 (86) |
30 (86) |
29 (84) |
29 (84) |
29 (84) |
30 (85) |
| Mean daily minimum °C (°F) | 23 (73) |
22 (72) |
23 (73) |
23 (73) |
24 (75) |
25 (77) |
24 (75) |
24 (75) |
24 (75) |
24 (75) |
23 (73) |
23 (73) |
24 (74) |
| Average precipitation mm (inches) | 102 (4.0) |
85 (3.3) |
91 (3.6) |
75 (3.0) |
110 (4.3) |
141 (5.6) |
121 (4.8) |
107 (4.2) |
111 (4.4) |
144 (5.7) |
169 (6.7) |
139 (5.5) |
1,395 (55.1) |
| Average rainy days | 18.6 | 14.8 | 16.5 | 16.7 | 23.9 | 26.4 | 25.6 | 24.1 | 24.4 | 26.3 | 23.7 | 20.5 | 261.5 |
| Source: Meteoblue [11] | |||||||||||||
Demographics
| Year | Pop. | ±% p.a. |
|---|---|---|
| 1903 | 6,853 | — |
| 1918 | 8,314 | +1.30% |
| 1939 | 9,272 | +0.52% |
| 1948 | 8,939 | −0.41% |
| 1960 | 8,929 | −0.01% |
| 1970 | 9,965 | +1.10% |
| 1975 | 11,522 | +2.95% |
| 1980 | 11,619 | +0.17% |
| 1990 | 14,242 | +2.06% |
| 1995 | 14,299 | +0.07% |
| 2000 | 16,485 | +3.10% |
| 2007 | 17,254 | +0.63% |
| 2010 | 17,580 | +0.68% |
| 2015 | 17,876 | +0.32% |
| 2020 | 18,861 | +1.14% |
| 2024 | 19,136 | +0.35% |
| Source: Philippine Statistics Authority[12][13][10][14][15] | ||
Economy
Poverty incidence of Duero
10
20
30
40
50
60
2000
39.49 2003
29.41 2006
38.00 2009
51.69 2012
29.61 2015
29.60 2018
21.60 2021
23.18 Source: Philippine Statistics Authority[16][17][18][19][20][21][22][23] |
Gallery
-
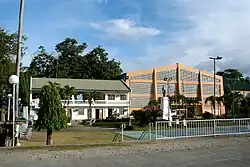
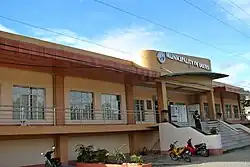 Duero town hall
 -
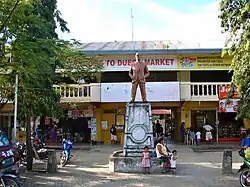 Public market
 -
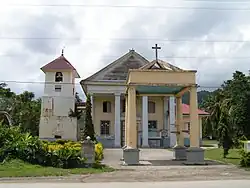 Church
References
- ^ "2025 Election Results - Region VII - Bohol - Duero". Commission on Elections (Philippines). May 12, 2025.
- ^ Municipality of Duero | (DILG)
- ^ "2015 Census of Population, Report No. 3 – Population, Land Area, and Population Density" (PDF). Philippine Statistics Authority. Quezon City, Philippines. August 2016. ISSN 0117-1453. Archived (PDF) from the original on May 25, 2021. Retrieved July 16, 2021.
- ^ "2024 Census of Population (POPCEN) Population Counts Declared Official by the President". Philippine Statistics Authority. 17 July 2025. Retrieved 18 July 2025.
- ^ "PSA Releases the 2021 City and Municipal Level Poverty Estimates". Philippine Statistics Authority. 2 April 2024. Retrieved 28 April 2024.
- ^ "2024 Census of Population (POPCEN) Population Counts Declared Official by the President". Philippine Statistics Authority. 17 July 2025. Retrieved 18 July 2025.
- ^ "Bohol Festivals Timetable". www.bohol-philippines.com. Retrieved 2019-03-07.
- ^ "Municipality of Duero". Retrieved 30 January 2015.
- ^ Census of Population (2020). "Region VII (Central Visayas)". Total Population by Province, City, Municipality and Barangay. Philippine Statistics Authority. Retrieved 8 July 2021.
- ^ a b Census of Population and Housing (2010). "Region VII (Central Visayas)" (PDF). Total Population by Province, City, Municipality and Barangay. National Statistics Office. Retrieved 29 June 2016.
- ^ "Duero: Average Temperatures and Rainfall". Meteoblue. Retrieved 9 May 2020.
- ^ "2024 Census of Population (POPCEN) Population Counts Declared Official by the President". Philippine Statistics Authority. 17 July 2025. Retrieved 18 July 2025.
- ^ Census of Population (2015). "Region VII (Central Visayas)". Total Population by Province, City, Municipality and Barangay. Philippine Statistics Authority. Retrieved 20 June 2016.
- ^ Censuses of Population (1903–2007). "Region VII (Central Visayas)". Table 1. Population Enumerated in Various Censuses by Province/Highly Urbanized City: 1903 to 2007. National Statistics Office.
- ^ "Province of Bohol". Municipality Population Data. Local Water Utilities Administration Research Division. Retrieved 17 December 2016.
- ^ "Poverty incidence (PI):". Philippine Statistics Authority. Retrieved December 28, 2020.
- ^ "Estimation of Local Poverty in the Philippines" (PDF). Philippine Statistics Authority. 29 November 2005.
- ^ "2003 City and Municipal Level Poverty Estimates" (PDF). Philippine Statistics Authority. 23 March 2009.
- ^ "City and Municipal Level Poverty Estimates; 2006 and 2009" (PDF). Philippine Statistics Authority. 3 August 2012.
- ^ "2012 Municipal and City Level Poverty Estimates" (PDF). Philippine Statistics Authority. 31 May 2016.
- ^ "Municipal and City Level Small Area Poverty Estimates; 2009, 2012 and 2015". Philippine Statistics Authority. 10 July 2019.
- ^ "PSA Releases the 2018 Municipal and City Level Poverty Estimates". Philippine Statistics Authority. 15 December 2021. Retrieved 22 January 2022.
- ^ "PSA Releases the 2021 City and Municipal Level Poverty Estimates". Philippine Statistics Authority. 2 April 2024. Retrieved 28 April 2024.
External links
Places adjacent to Duero, Bohol | |
|---|---|
Tagbilaran (capital and largest city) | |
| Municipalities |
|
| Component city | |
| Islands |
|