Experiment, Georgia
Experiment, Georgia | |
|---|---|
 Location in Spalding County and the state of Georgia | |
| Coordinates: 33°16′28″N 84°16′29″W / 33.27444°N 84.27472°W | |
| Country | United States |
| State | Georgia |
| County | Spalding |
| Area | |
• Total | 2.98 sq mi (7.72 km2) |
| • Land | 2.97 sq mi (7.70 km2) |
| • Water | 0.01 sq mi (0.02 km2) |
| Elevation | 945 ft (288 m) |
| Population (2020) | |
• Total | 3,328 |
| • Density | 1,119.41/sq mi (432.17/km2) |
| Time zone | UTC-5 (Eastern (EST)) |
| • Summer (DST) | UTC-4 (EDT) |
| ZIP code | 30212 |
| Area code | 770 |
| FIPS code | 13-28296[2] |
| GNIS feature ID | 0331680[3] |
Experiment is an unincorporated community and census-designated place (CDP) in Spalding County, Georgia, United States. The population was 3,328 in 2020.
History
Experiment is named for the University of Georgia Agricultural Experiment Station located there.[4] Experiment has been noted for its unusual place name.[5]
The community was heavily damaged by an EF3 tornado on January 12, 2023. The tornado injured 18 people along its path.[6]
Geography
Experiment is located at 33°16′28″N 84°16′29″W / 33.27444°N 84.27472°W (33.274505, -84.274758),[7] immediately north of Griffin and approximately 30 miles (48.3 km) south-southeast of Atlanta.
According to the United States Census Bureau, the CDP has a total area of 3.0 square miles (7.8 km2), all land.
Climate
| Climate data for Experiment, Georgia, 1991–2020 normals, extremes 1900–2004 | |||||||||||||
|---|---|---|---|---|---|---|---|---|---|---|---|---|---|
| Month | Jan | Feb | Mar | Apr | May | Jun | Jul | Aug | Sep | Oct | Nov | Dec | Year |
| Record high °F (°C) | 79 (26) |
89 (32) |
88 (31) |
93 (34) |
97 (36) |
103 (39) |
104 (40) |
101 (38) |
103 (39) |
96 (36) |
86 (30) |
79 (26) |
104 (40) |
| Mean daily maximum °F (°C) | 55.6 (13.1) |
59.0 (15.0) |
66.8 (19.3) |
74.1 (23.4) |
81.2 (27.3) |
87.3 (30.7) |
89.8 (32.1) |
88.5 (31.4) |
83.9 (28.8) |
75.0 (23.9) |
65.8 (18.8) |
58.0 (14.4) |
73.7 (23.2) |
| Daily mean °F (°C) | 45.0 (7.2) |
47.7 (8.7) |
55.5 (13.1) |
62.1 (16.7) |
70.2 (21.2) |
76.6 (24.8) |
79.4 (26.3) |
78.2 (25.7) |
73.7 (23.2) |
63.6 (17.6) |
54.0 (12.2) |
47.2 (8.4) |
62.8 (17.1) |
| Mean daily minimum °F (°C) | 34.3 (1.3) |
36.5 (2.5) |
44.3 (6.8) |
50.1 (10.1) |
59.1 (15.1) |
66.0 (18.9) |
69.0 (20.6) |
68.0 (20.0) |
63.5 (17.5) |
52.2 (11.2) |
42.1 (5.6) |
36.4 (2.4) |
51.8 (11.0) |
| Record low °F (°C) | −8 (−22) |
5 (−15) |
11 (−12) |
25 (−4) |
35 (2) |
44 (7) |
51 (11) |
51 (11) |
35 (2) |
26 (−3) |
5 (−15) |
0 (−18) |
−8 (−22) |
| Average precipitation inches (mm) | 5.27 (134) |
4.32 (110) |
5.08 (129) |
4.04 (103) |
3.71 (94) |
4.91 (125) |
5.07 (129) |
5.08 (129) |
4.39 (112) |
3.31 (84) |
4.01 (102) |
5.00 (127) |
54.19 (1,378) |
| Average snowfall inches (cm) | 1.1 (2.8) |
0.0 (0.0) |
0.1 (0.25) |
0.0 (0.0) |
0.0 (0.0) |
0.0 (0.0) |
0.0 (0.0) |
0.0 (0.0) |
0.0 (0.0) |
0.0 (0.0) |
0.0 (0.0) |
0.0 (0.0) |
1.2 (3.05) |
| Average precipitation days (≥ 0.01 in) | 11.7 | 10.2 | 10.4 | 9.2 | 9.0 | 12.7 | 11.8 | 10.2 | 7.7 | 7.5 | 9.2 | 11.1 | 120.7 |
| Average snowy days (≥ 0.1 in) | 0.2 | 0.0 | 0.1 | 0.0 | 0.0 | 0.0 | 0.0 | 0.0 | 0.0 | 0.0 | 0.0 | 0.0 | 0.3 |
| Source 1: NOAA (snow/snow days 1981–2010)[8][9] | |||||||||||||
| Source 2: National Weather Service[10] | |||||||||||||
Demographics
| Census | Pop. | Note | %± |
|---|---|---|---|
| 1950 | 4,265 | — | |
| 1960 | 2,497 | −41.5% | |
| 1970 | 2,256 | −9.7% | |
| 1980 | 3,731 | 65.4% | |
| 1990 | 3,762 | 0.8% | |
| 2000 | 3,233 | −14.1% | |
| 2010 | 2,894 | −10.5% | |
| 2020 | 3,328 | 15.0% | |
| U.S. Decennial Census[11] 1850-1870[12] 1870-1880[13] 1890-1910[14] 1920-1930[15] 1940[16] 1950[17] 1960[18] 1970[19] 1980[20] 1990[21] 2000[22] 2010[23] 2020[24] | |||
| Race / Ethnicity (NH = Non-Hispanic) | Pop 2000[25] | Pop. 2010[26] | Pop. 2020[24] | % 2000 | % 2010 | % 2020 |
|---|---|---|---|---|---|---|
| White alone (NH) | 1,455 | 1,220 | 967 | 45.00% | 42.16% | 29.06% |
| Black or African American alone (NH) | 1,694 | 1,504 | 2,024 | 52.40% | 51.97% | 60.82% |
| Native American or Alaska Native alone (NH) | 5 | 10 | 4 | 0.15% | 0.35% | 0.12% |
| Asian alone (NH) | 1 | 4 | 11 | 0.03% | 0.14% | 0.33% |
| Pacific Islander alone (NH) | 0 | 5 | 0 | 0.00% | 0.17% | 0.00% |
| Some other race alone (NH) | 4 | 4 | 7 | 0.12% | 0.14% | 0.21% |
| Mixed-race or multi-racial (NH) | 34 | 35 | 113 | 1.05% | 1.21% | 3.40% |
| Hispanic or Latino (any race) | 40 | 112 | 202 | 1.24% | 3.87% | 6.07% |
| Total | 3,233 | 2,894 | 3,328 | 100.00% | 100.00% | 100.00% |
Experiment was first listed as an unincorporated place in the 1950 U.S. census[17] and then designated a census designated place in 1980 U.S. census.[20]
References
- ^ "2020 U.S. Gazetteer Files". United States Census Bureau. Retrieved December 18, 2021.
- ^ "U.S. Census website". United States Census Bureau. Retrieved January 31, 2008.
- ^ "US Board on Geographic Names". United States Geological Survey. October 25, 2007. Retrieved January 31, 2008.
- ^ Moyer, Armond; Moyer, Winifred (1958). The origins of unusual place-names. Keystone Pub. Associates. p. 46.
- ^ "The Oddest Named Town in Every State". The Active Times. April 19, 2018. Retrieved July 3, 2019.
- ^ "January 12, 2023 Tornado Outbreak". www.weather.gov. National Weather Service Peachtree City GA. Retrieved January 21, 2023.
- ^ "US Gazetteer files: 2010, 2000, and 1990". United States Census Bureau. February 12, 2011. Retrieved April 23, 2011.
- ^ "U.S. Climate Normals Quick Access – Station: Experiment, GA (1991–2020)". National Oceanic and Atmospheric Administration. Retrieved February 27, 2023.
- ^ "U.S. Climate Normals Quick Access – Station: Experiment, GA (1981–2010)". National Oceanic and Atmospheric Administration. Retrieved February 27, 2023.
- ^ "NOAA Online Weather Data – NWS Atlanta". National Weather Service. Retrieved February 27, 2023.
- ^ "Decennial Census of Population and Housing by Decade". United States Census Bureau.
- ^ "1870 Census of Population - Georgia - Population of Civil Divisions less than Counties" (PDF). United States Census Bureau. 1870.
- ^ "1880 Census of Population - Georgia - Population of Civil Divisions less than Counties" (PDF). United States Census Bureau. 1880.
- ^ "1910 Census of Population - Georgia" (PDF). United States Census Bureau. 1910.
- ^ "1930 Census of Population - Georgia" (PDF). United States Census Bureau. 1930. pp. 251–256.
- ^ "1940 Census of Population - Georgia" (PDF). United States Census Bureau. 1940.
- ^ a b "1950 Census of Population - Georgia" (PDF). United States Census Bureau. 1950.
- ^ "1960 Census of Population - Population of County Subdivisions - Georgia" (PDF). United States Census Bureau. 1960.
- ^ "1970 Census of Population - Population of County Subdivisions - Georgia" (PDF). United States Census Bureau. 1970.
- ^ a b "1980 Census of Population - Number of Inhabitants - Georgia" (PDF). United States Census Bureau. 1980.
- ^ "1990 Census of Population - Summary Social, Economic, and Housing Characteristics - Georgia" (PDF). United States Census Bureau. 1990.
- ^ "2000 Census of Population - General Population Characteristics - Georgia" (PDF). United States Census Bureau. 2000.
- ^ "2010 Census of Population - General Population Characteristics - Georgia" (PDF). United States Census Bureau. 2010.
- ^ a b "P2: Hispanic or Latino, and Not Hispanic or Latino by Race – 2020: DEC Redistricting Data (PL 94-171) – Experiment CDP, Georgia". United States Census Bureau. Retrieved February 25, 2024.
- ^ "P004 Hispanic or Latino, and Not Hispanic or Latino by Race – 2000: DEC Summary File 1 – Experiment CDP, Georgia". United States Census Bureau. Retrieved February 25, 2024.
- ^ "P2: Hispanic or Latino, and Not Hispanic or Latino by Race – 2010: DEC Redistricting Data (PL 94-171) – Experiment CDP, Georgia". United States Census Bureau. Retrieved February 25, 2024.
External links
Municipalities and communities of Spalding County, Georgia, United States | ||
|---|---|---|
| Cities | 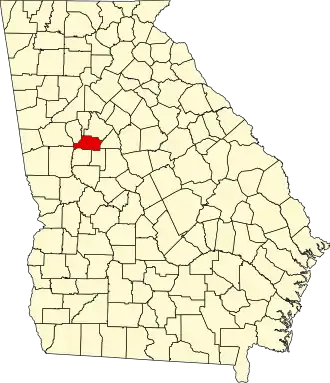 | |
| Town | ||
| CDPs | ||
| Unincorporated communities | ||
| Footnotes | ‡This populated place also has portions in an adjacent county or counties | |