Fersit
Fersit
| |
|---|---|
 View from Stob a' Choire Mheadhoin, the large mountain (at 1,105 m) visible from Fersit. | |
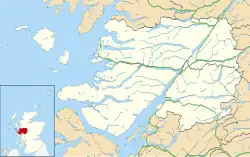 Fersit Location within the Lochaber area | |
| OS grid reference | NN357779 |
| Council area | |
| Country | Scotland |
| Sovereign state | United Kingdom |
| Postcode district | PH31 4 |
| Police | Scotland |
| Fire | Scottish |
| Ambulance | Scottish |
Fersit (Scottish Gaelic: Fearsaid Mhòr) is a hamlet close to Tulloch railway station in Lochaber, Scottish Highlands and is in the Highland council area.
The River Treig, the outlet of Loch Treig, runs past Fersit.
Fersit had a small station on the West Highland Line, known as Fersit Halt. This was a temporary structure, used during the construction of the Lochaber hydro-electric scheme, and closed in 1935. The Lochaber Narrow Gauge Railway, a railway line built for the construction of the hydro scheme, also passed by Fersit.
Climate
Fersit has a local Met Office weather station, Tulloch Bridge. Overall it is generally colder and wetter than the UK average but with cold winters and mild summers.
| Climate data for Tulloch Bridge, elevation 237 m (778 ft), (1991–2020 normals, extremes 1990–present) | |||||||||||||
|---|---|---|---|---|---|---|---|---|---|---|---|---|---|
| Month | Jan | Feb | Mar | Apr | May | Jun | Jul | Aug | Sep | Oct | Nov | Dec | Year |
| Record high °C (°F) | 13.8 (56.8) |
14.0 (57.2) |
19.9 (67.8) |
23.4 (74.1) |
26.5 (79.7) |
29.9 (85.8) |
28.4 (83.1) |
29.0 (84.2) |
26.4 (79.5) |
18.8 (65.8) |
16.3 (61.3) |
13.9 (57.0) |
29.9 (85.8) |
| Mean daily maximum °C (°F) | 5.7 (42.3) |
6.0 (42.8) |
7.6 (45.7) |
10.6 (51.1) |
14.0 (57.2) |
16.0 (60.8) |
17.5 (63.5) |
17.0 (62.6) |
14.9 (58.8) |
11.2 (52.2) |
8.0 (46.4) |
5.9 (42.6) |
11.2 (52.2) |
| Daily mean °C (°F) | 2.8 (37.0) |
2.9 (37.2) |
4.3 (39.7) |
6.5 (43.7) |
9.3 (48.7) |
11.8 (53.2) |
13.5 (56.3) |
13.1 (55.6) |
11.2 (52.2) |
8.0 (46.4) |
5.1 (41.2) |
2.7 (36.9) |
7.6 (45.7) |
| Mean daily minimum °C (°F) | −0.1 (31.8) |
−0.2 (31.6) |
0.9 (33.6) |
2.4 (36.3) |
4.6 (40.3) |
7.7 (45.9) |
9.5 (49.1) |
9.3 (48.7) |
7.5 (45.5) |
4.8 (40.6) |
2.2 (36.0) |
−0.5 (31.1) |
4.0 (39.2) |
| Record low °C (°F) | −19.0 (−2.2) |
−17.3 (0.9) |
−15.0 (5.0) |
−9.4 (15.1) |
−6.3 (20.7) |
−3.3 (26.1) |
0.4 (32.7) |
−1.8 (28.8) |
−4.2 (24.4) |
−7.5 (18.5) |
−11.7 (10.9) |
−20.5 (−4.9) |
−20.5 (−4.9) |
| Average precipitation mm (inches) | 250.0 (9.84) |
186.6 (7.35) |
154.0 (6.06) |
103.3 (4.07) |
95.3 (3.75) |
88.1 (3.47) |
94.2 (3.71) |
108.3 (4.26) |
129.7 (5.11) |
191.2 (7.53) |
203.4 (8.01) |
222.8 (8.77) |
1,826.8 (71.92) |
| Average precipitation days (≥ 1.0 mm) | 19.6 | 17.7 | 18.0 | 15.2 | 14.5 | 14.6 | 16.0 | 16.4 | 16.4 | 19.5 | 19.7 | 19.1 | 206.5 |
| Source 1: Met Office[1] | |||||||||||||
| Source 2: Starlings Roost Weather[2] | |||||||||||||
References
- ^ "Tulloch Bridge (Highland) UK climate averages". Met Office. Retrieved 21 March 2020.
- ^ "Monthly Extreme Maximum Temperature, Monthly Extreme Minimum Temperature". Starlings Roost Weather. Archived from the original on 1 February 2023. Retrieved 17 December 2024.