Huejuquilla El Alto
Huejuquilla El Alto | |
|---|---|
Municipality and town | |
 Coat of arms | |
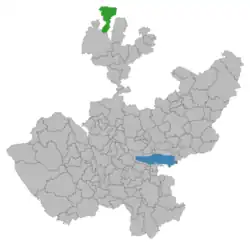 Location of the municipality in Jalisco | |
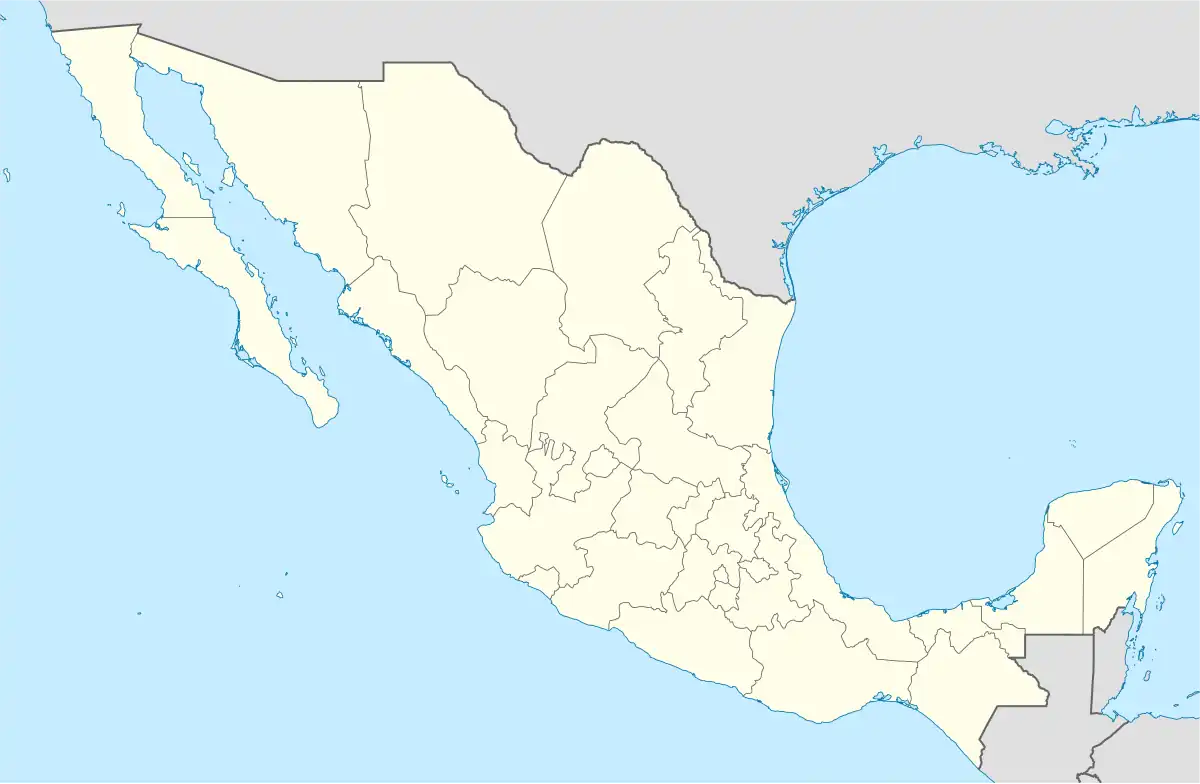 Huejuquilla El Alto Location in Mexico | |
| Coordinates: 22°37′32″N 103°53′47″W / 22.62556°N 103.89639°W | |
| Country | |
| State | Jalisco |
| Area | |
• Total | 769.5 km2 (297.1 sq mi) |
| • Town | 3.1 km2 (1.2 sq mi) |
| Population (2020 census)[1] | |
• Total | 10,015 |
| • Density | 13/km2 (34/sq mi) |
| • Town | 5,949 |
| • Town density | 1,900/km2 (5,000/sq mi) |
Huejuquilla El Alto is a town and municipality in Jalisco in central-western Mexico, being the northernmost municipality in Jalisco. The municipality covers an area of 769.5 km2.
As of 2005, the municipality had a total population of 7,926.[2]
Climate
| Climate data for Huejuquilla El Alto (1991–2020 normals, extremes 1986–2019) | |||||||||||||
|---|---|---|---|---|---|---|---|---|---|---|---|---|---|
| Month | Jan | Feb | Mar | Apr | May | Jun | Jul | Aug | Sep | Oct | Nov | Dec | Year |
| Record high °C (°F) | 31 (88) |
32.5 (90.5) |
32.5 (90.5) |
38 (100) |
38 (100) |
38.5 (101.3) |
37 (99) |
33 (91) |
34 (93) |
33 (91) |
30 (86) |
34 (93) |
38.5 (101.3) |
| Mean daily maximum °C (°F) | 21.6 (70.9) |
23.2 (73.8) |
24.0 (75.2) |
27.5 (81.5) |
29.9 (85.8) |
29.3 (84.7) |
26.5 (79.7) |
26.1 (79.0) |
25.5 (77.9) |
25.2 (77.4) |
23.4 (74.1) |
21.7 (71.1) |
25.3 (77.5) |
| Daily mean °C (°F) | 11.1 (52.0) |
12.4 (54.3) |
13.8 (56.8) |
16.4 (61.5) |
19.0 (66.2) |
20.3 (68.5) |
18.6 (65.5) |
18.2 (64.8) |
17.6 (63.7) |
16.2 (61.2) |
13.4 (56.1) |
11.5 (52.7) |
15.7 (60.3) |
| Mean daily minimum °C (°F) | 0.7 (33.3) |
1.6 (34.9) |
3.6 (38.5) |
5.4 (41.7) |
8.2 (46.8) |
11.4 (52.5) |
10.7 (51.3) |
10.3 (50.5) |
9.7 (49.5) |
7.1 (44.8) |
3.3 (37.9) |
1.3 (34.3) |
6.1 (43.0) |
| Record low °C (°F) | −8 (18) |
−11 (12) |
−5.5 (22.1) |
−2 (28) |
0 (32) |
0 (32) |
0 (32) |
0 (32) |
0 (32) |
0 (32) |
−8 (18) |
−9 (16) |
−11 (12) |
| Average precipitation mm (inches) | 5.7 (0.22) |
9.0 (0.35) |
4.4 (0.17) |
4.6 (0.18) |
4.6 (0.18) |
58.1 (2.29) |
108.8 (4.28) |
96.4 (3.80) |
93.2 (3.67) |
40.9 (1.61) |
7.1 (0.28) |
6.6 (0.26) |
439.4 (17.30) |
| Average rainy days | 0.9 | 1.0 | 0.5 | 0.6 | 0.9 | 6.8 | 12.7 | 11.6 | 9.9 | 4.2 | 1.1 | 1.1 | 51.3 |
| Source: Servicio Meteorológico Nacional[3][4] | |||||||||||||
References
- ^ Citypopulation.de Population of Huejuquilla El Alto municipality with localities
- ^ "Huejuquilla El Alto". Enciclopedia de los Municipios de México. Instituto Nacional para el Federalismo y el Desarrollo Municipal. Archived from the original on November 29, 2006. Retrieved April 13, 2009.
- ^ "NORMAL CLIMATOLÓGICA 1991-2020" (TXT) (in Spanish). Servicio Meteorológico National. Archived from the original on December 2, 2024. Retrieved December 2, 2024.
- ^ "VALORES EXTREMOS" (TXT) (in Spanish). Servicio Meteorológico National. Archived from the original on December 2, 2024. Retrieved December 2, 2024.