Lopez Jaena
Lopez Jaena | |
|---|---|
| Municipality of Lopez Jaena | |
 Flag | |
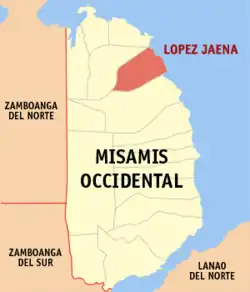 Map of Misamis Occidental with Lopez Jaena highlighted | |
OpenStreetMap | |
.svg.png) Lopez Jaena Location within the Philippines | |
| Coordinates: 8°33′00″N 123°46′00″E / 8.55°N 123.7666667°E | |
| Country | Philippines |
| Region | Northern Mindanao |
| Province | Misamis Occidental |
| District | 1st district |
| Founded | August 1, 1929 |
| Named after | Graciano López Jaena |
| Barangays | 28 (see Barangays) |
| Government | |
| • Type | Sangguniang Bayan |
| • Mayor | Andrea Cherry Pink "Pinky" L. Gutierrez (Asenso Pinoy Party) |
| • Vice Mayor | Abundio "Bonjing" P. Gerbese (Asenso Pinoy Party) |
| • Representative | Jason P. Almonte (NP) |
| • Municipal Council | Members |
| • Electorate | 18,771 voters (2025) |
| Area | |
• Total | 94.70 km2 (36.56 sq mi) |
| Elevation | 23 m (75 ft) |
| Highest elevation | 196 m (643 ft) |
| Lowest elevation | 0 m (0 ft) |
| Population (2024 census)[3] | |
• Total | 25,806 |
| • Density | 270/km2 (710/sq mi) |
| • Households | 6,282 |
| Economy | |
| • Income class | 3rd municipal income class |
| • Poverty incidence | 36.54 |
| • Revenue | ₱ 158 million (2022) |
| • Assets | ₱ 472.1 million (2022) |
| • Expenditure | ₱ 130.2 million (2022) |
| • Liabilities | ₱ 118.7 million (2022) |
| Service provider | |
| • Electricity | Misamis Occidental 1 Electric Cooperative (MOELCI 1) |
| Time zone | UTC+8 (PST) |
| ZIP code | 7208 |
| PSGC | |
| IDD : area code | +63 (0)88 |
| Native languages | Subanon Cebuano Tagalog |
| Website | www |
Lopez Jaena, officially the Municipality of Lopez Jaena (Cebuano: Lungsod sa Lopez Jaena; Subanen: Benwa D' Lopez Jaena; Tagalog: Bayan ng Lopez Jaena), is a municipality in the province of Misamis Occidental, Philippines and a suburb of neighboring Oroquieta City. According to the 2024 census, it has a population of 25,806 people.[5]
Geography
Barangays
Lopez Jaena is politically subdivided into 28 barangays. Each barangay consists of puroks while some have sitios.
- Alegria
- Bagong Silang
- Biasong
- Bonifacio
- Burgos
- Dalacon
- Dampalan
- Estante
- Hasa-an
- Katipa
- Luzaran
- Macalibre Alto
- Macalibre Bajo
- Mahayahay
- Manguehan
- Mansabay Bajo
- Molatuhan Alto
- Molatuhan Bajo
- Peniel
- Eastern Poblacion
- Puntod
- Rizal
- Sibugon
- Sibula
- Don Andres Soriano
- Mabas
- Mansabay Alto
- Western Poblacion
Climate
| Climate data for Lopez Jaena, Misamis Occidental | |||||||||||||
|---|---|---|---|---|---|---|---|---|---|---|---|---|---|
| Month | Jan | Feb | Mar | Apr | May | Jun | Jul | Aug | Sep | Oct | Nov | Dec | Year |
| Mean daily maximum °C (°F) | 27 (81) |
28 (82) |
29 (84) |
31 (88) |
31 (88) |
30 (86) |
30 (86) |
30 (86) |
30 (86) |
30 (86) |
29 (84) |
28 (82) |
29 (85) |
| Mean daily minimum °C (°F) | 23 (73) |
23 (73) |
23 (73) |
23 (73) |
24 (75) |
24 (75) |
23 (73) |
23 (73) |
24 (75) |
24 (75) |
23 (73) |
23 (73) |
23 (74) |
| Average precipitation mm (inches) | 69 (2.7) |
44 (1.7) |
37 (1.5) |
29 (1.1) |
87 (3.4) |
137 (5.4) |
131 (5.2) |
141 (5.6) |
143 (5.6) |
134 (5.3) |
68 (2.7) |
53 (2.1) |
1,073 (42.3) |
| Average rainy days | 9.9 | 7.6 | 7.4 | 8.1 | 21.6 | 26.5 | 26.4 | 26.6 | 25.8 | 24.3 | 15.1 | 10.4 | 209.7 |
| Source: Meteoblue[6] | |||||||||||||
Demographics
|
| ||||||||||||||||||||||||||||||||||||||||||||||||
| Source: Philippine Statistics Authority[7][8][9][10][11] | |||||||||||||||||||||||||||||||||||||||||||||||||
In the 2020 census, the population of Lopez Jaena was 25,806 people,[12] with a density of 270 inhabitants per square kilometre or 700 inhabitants per square mile.
Economy
Poverty incidence of Lopez Jaena
10
20
30
40
50
60
2000
57.29 2003
58.96 2006
48.00 2009
49.25 2012
44.21 2015
39.63 2018
28.21 2021
36.54 Source: Philippine Statistics Authority[13][14][15][16][17][18][19][20] |
References
- ^ Municipality of Lopez Jaena | (DILG)
- ^ "2015 Census of Population, Report No. 3 – Population, Land Area, and Population Density" (PDF). Philippine Statistics Authority. Quezon City, Philippines. August 2016. ISSN 0117-1453. Archived (PDF) from the original on May 25, 2021. Retrieved July 16, 2021.
- ^ "2024 Census of Population (POPCEN) Population Counts Declared Official by the President". Philippine Statistics Authority. 17 July 2025. Retrieved 18 July 2025.
- ^ "PSA Releases the 2021 City and Municipal Level Poverty Estimates". Philippine Statistics Authority. 2 April 2024. Retrieved 28 April 2024.
- ^ "2024 Census of Population (POPCEN) Population Counts Declared Official by the President". Philippine Statistics Authority. 17 July 2025. Retrieved 18 July 2025.
- ^ "Lopez Jaena: Average Temperatures and Rainfall". Meteoblue. Retrieved 29 April 2020.
- ^ "2024 Census of Population (POPCEN) Population Counts Declared Official by the President". Philippine Statistics Authority. 17 July 2025. Retrieved 18 July 2025.
- ^ Census of Population (2015). "Region X (Northern Mindanao)". Total Population by Province, City, Municipality and Barangay. Philippine Statistics Authority. Retrieved 20 June 2016.
- ^ Census of Population and Housing (2010). "Region X (Northern Mindanao)" (PDF). Total Population by Province, City, Municipality and Barangay. National Statistics Office. Retrieved 29 June 2016.
- ^ Censuses of Population (1903–2007). "Region X (Northern Mindanao)". Table 1. Population Enumerated in Various Censuses by Province/Highly Urbanized City: 1903 to 2007. National Statistics Office.
- ^ "Province of". Municipality Population Data. Local Water Utilities Administration Research Division. Retrieved 17 December 2016.
- ^ "2024 Census of Population (POPCEN) Population Counts Declared Official by the President". Philippine Statistics Authority. 17 July 2025. Retrieved 18 July 2025.
- ^ "Poverty incidence (PI):". Philippine Statistics Authority. Retrieved December 28, 2020.
- ^ "Estimation of Local Poverty in the Philippines" (PDF). Philippine Statistics Authority. 29 November 2005.
- ^ "2003 City and Municipal Level Poverty Estimates" (PDF). Philippine Statistics Authority. 23 March 2009.
- ^ "City and Municipal Level Poverty Estimates; 2006 and 2009" (PDF). Philippine Statistics Authority. 3 August 2012.
- ^ "2012 Municipal and City Level Poverty Estimates" (PDF). Philippine Statistics Authority. 31 May 2016.
- ^ "Municipal and City Level Small Area Poverty Estimates; 2009, 2012 and 2015". Philippine Statistics Authority. 10 July 2019.
- ^ "PSA Releases the 2018 Municipal and City Level Poverty Estimates". Philippine Statistics Authority. 15 December 2021. Retrieved 22 January 2022.
- ^ "PSA Releases the 2021 City and Municipal Level Poverty Estimates". Philippine Statistics Authority. 2 April 2024. Retrieved 28 April 2024.
External links
- Philippine Standard Geographic Code
- Philippine Census Information
- Local Governance Performance Management System
Places adjacent to Lopez Jaena | ||||||||||||||||
|---|---|---|---|---|---|---|---|---|---|---|---|---|---|---|---|---|
| ||||||||||||||||
| Municipalities | |
|---|---|
| Component cities | |