Maria, Siquijor
Maria | |
|---|---|
| Municipality of Maria | |
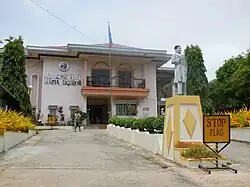 Maria Town Hall | |
 Flag | |
 Map of Siquijor with Maria highlighted | |
OpenStreetMap | |
.svg.png) Maria Location within the Philippines | |
| Coordinates: 9°11′46″N 123°39′18″E / 9.196°N 123.655°E | |
| Country | Philippines |
| Region | Negros Island Region |
| Province | Siquijor |
| District | Lone district |
| Barangays | 22 (see Barangays) |
| Government | |
| • Type | Sangguniang Bayan |
| • Mayor | Roselyn T. Asok (PFP) |
| • Vice Mayor | Meynard R. Asok (PFP) |
| • Representative | Zaldy Villa (Lakas) |
| • Municipal Council | Members |
| • Electorate | 11,532 voters (2025) |
| Area | |
• Total | 53.37 km2 (20.61 sq mi) |
| Elevation | 23.8 m (78.1 ft) |
| Highest elevation | 448 m (1,470 ft) |
| Lowest elevation | 0 m (0 ft) |
| Population (2024 census)[4] | |
• Total | 15,146 |
| • Density | 280/km2 (740/sq mi) |
| • Households | 3,545 |
| Economy | |
| • Income class | 5th municipal income class |
| • Poverty incidence | 9.57 |
| • Revenue | ₱ 113 million (2022) |
| • Assets | ₱ 122.2 million (2022) |
| • Expenditure | ₱ 92.85 million (2022) |
| • Liabilities | ₱ 27.17 million (2022) |
| Service provider | |
| • Electricity | Province of Siquijor Electric Cooperative (PROSIELCO) |
| Time zone | UTC+8 (PST) |
| ZIP code | 6229 |
| PSGC | |
| IDD : area code | +63 (0)35 |
| Native languages | Cebuano Tagalog |
| Patron saint | Our Lady of Divine Providence |
Maria, officially the Municipality of Maria (Cebuano: Lungsod sa Maria; Tagalog: Bayan ng Maria), is a municipality in the province of Siquijor, Philippines. According to the 2020 census, it has a population of 14,385.[6]
Maria is 32 kilometres (20 mi) from Siquijor.
Geography
Barangays
Maria is politically subdivided into 22 barangays. Each barangay consists of puroks and some have sitios.
| PSGC | Barangay | Population | ±% p.a. | |||
|---|---|---|---|---|---|---|
| 2024[7] | 2010[8] | |||||
| 076104001 | Bogo | 5.6% | 851 | 739 | 0.99% | |
| 076104002 | Bonga | 3.7% | 555 | 459 | 1.34% | |
| 076104003 | Cabal‑asan | 2.6% | 389 | 357 | 0.60% | |
| 076104004 | Calunasan | 4.2% | 643 | 641 | 0.02% | |
| 076104005 | Candaping A | 3.8% | 582 | 448 | 1.85% | |
| 076104006 | Candaping B | 4.5% | 684 | 591 | 1.03% | |
| 076104007 | Cantaroc A | 3.1% | 462 | 385 | 1.28% | |
| 076104008 | Cantaroc B | 3.3% | 501 | 411 | 1.39% | |
| 076104009 | Cantugbas | 2.7% | 412 | 400 | 0.21% | |
| 076104010 | Lico‑an | 3.3% | 496 | 529 | −0.45% | |
| 076104011 | Lilo‑an | 9.6% | 1,459 | 1,470 | −0.05% | |
| 076104013 | Logucan | 4.3% | 647 | 557 | 1.05% | |
| 076104012 | Looc | 3.2% | 489 | 528 | −0.53% | |
| 076104014 | Minalulan | 5.6% | 843 | 703 | 1.28% | |
| 076104015 | Nabutay | 6.6% | 1,000 | 718 | 2.34% | |
| 076104016 | Olang | 4.6% | 701 | 592 | 1.19% | |
| 076104017 | Pisong A | 2.4% | 366 | 292 | 1.59% | |
| 076104018 | Pisong B | 1.6% | 249 | 293 | −1.13% | |
| 076104019 | Poblacion Norte | 7.6% | 1,153 | 1,170 | −0.10% | |
| 076104020 | Poblacion Sur | 4.3% | 656 | 675 | −0.20% | |
| 076104021 | Saguing | 5.3% | 803 | 946 | −1.14% | |
| 076104022 | Sawang | 2.9% | 444 | 479 | −0.53% | |
| Total | 15,146 | 13,383 | 0.87% | |||
Climate
| Climate data for Maria, Siquijor | |||||||||||||
|---|---|---|---|---|---|---|---|---|---|---|---|---|---|
| Month | Jan | Feb | Mar | Apr | May | Jun | Jul | Aug | Sep | Oct | Nov | Dec | Year |
| Mean daily maximum °C (°F) | 29 (84) |
30 (86) |
31 (88) |
32 (90) |
31 (88) |
30 (86) |
30 (86) |
30 (86) |
30 (86) |
29 (84) |
29 (84) |
29 (84) |
30 (86) |
| Mean daily minimum °C (°F) | 22 (72) |
22 (72) |
22 (72) |
23 (73) |
24 (75) |
24 (75) |
24 (75) |
24 (75) |
24 (75) |
24 (75) |
23 (73) |
23 (73) |
23 (74) |
| Average precipitation mm (inches) | 26 (1.0) |
22 (0.9) |
28 (1.1) |
41 (1.6) |
95 (3.7) |
136 (5.4) |
147 (5.8) |
126 (5.0) |
132 (5.2) |
150 (5.9) |
98 (3.9) |
46 (1.8) |
1,047 (41.3) |
| Average rainy days | 7.5 | 6.7 | 8.9 | 10.4 | 21.6 | 25.6 | 26.3 | 25.0 | 24.1 | 26.2 | 19.2 | 12.1 | 213.6 |
| Source: Meteoblue[9] | |||||||||||||
Demographics
| Year | Pop. | ±% p.a. |
|---|---|---|
| 1903 | 6,499 | — |
| 1918 | 8,477 | +1.79% |
| 1939 | 8,722 | +0.14% |
| 1948 | 8,547 | −0.22% |
| 1960 | 9,335 | +0.74% |
| 1970 | 9,942 | +0.63% |
| 1975 | 10,778 | +1.63% |
| 1980 | 10,951 | +0.32% |
| 1990 | 11,140 | +0.17% |
| 1995 | 11,106 | −0.06% |
| 2000 | 12,275 | +2.17% |
| 2007 | 12,974 | +0.77% |
| 2010 | 13,383 | +1.14% |
| 2015 | 13,828 | +0.62% |
| 2020 | 14,385 | +0.83% |
| 2024 | 15,146 | +1.25% |
| Source: Philippine Statistics Authority[10][11][8][12][13] | ||
Economy

Poverty incidence of Maria
10
20
30
40
50
2000
35.12 2003
41.04 2006
36.30 2009
39.14 2012
25.40 2015
37.66 2018
24.90 2021
9.57 Source: Philippine Statistics Authority[14][15][16][17][18][19][20][21] |
Education
The public schools in the town of Maria are administered by one school district under the Schools Division of Siquijor.
Elementary schools:
- Bogo Elementary School — Bogo
- Candaping Elementary School — Candaping B
- Cantaroc Elementary School — Cantaroc B
- Cantugbas Elementary School — Cantugbas
- Lico-an Elementary School — Lico-an
- Lilo-an Elementary School — Lilo-an
- Logucan Elementary School — Logucan
- Minalulan Elementary School — Minalulan
- Nabutay Elementary School — Nabutay
- Pisong A Elementary School — Pisong A
- Pisong B Elementary School — Pisong B
High schools:
- Candaping National High School — Candaping B
Integrated schools:
- Maria Integrated School (formerly Maria CS) — Poblacion Norte
References
- ^ Municipality of Maria | (DILG)
- ^ "2015 Census of Population, Report No. 3 – Population, Land Area, and Population Density" (PDF). Philippine Statistics Authority. Quezon City, Philippines. August 2016. ISSN 0117-1453. Archived (PDF) from the original on May 25, 2021. Retrieved July 16, 2021.
- ^ https://www.philatlas.com/visayas/r07/siquijor/maria.html.
{{cite web}}: Missing or empty|title=(help) - ^ "2024 Census of Population (POPCEN) Population Counts Declared Official by the President". Philippine Statistics Authority. 17 July 2025. Retrieved 18 July 2025.
- ^ "PSA Releases the 2021 City and Municipal Level Poverty Estimates". Philippine Statistics Authority. 2 April 2024. Retrieved 28 April 2024.
- ^ "2024 Census of Population (POPCEN) Population Counts Declared Official by the President". Philippine Statistics Authority. 17 July 2025. Retrieved 18 July 2025.
- ^ Census of Population (2020). "Region VII (Central Visayas)". Total Population by Province, City, Municipality and Barangay. Philippine Statistics Authority. Retrieved 8 July 2021.
- ^ a b Census of Population and Housing (2010). "Region VII (Central Visayas)" (PDF). Total Population by Province, City, Municipality and Barangay. National Statistics Office. Retrieved 29 June 2016.
- ^ "Maria: Average Temperatures and Rainfall". Meteoblue. Retrieved 28 April 2020.
- ^ "2024 Census of Population (POPCEN) Population Counts Declared Official by the President". Philippine Statistics Authority. 17 July 2025. Retrieved 18 July 2025.
- ^ Census of Population (2015). "Region VII (Central Visayas)". Total Population by Province, City, Municipality and Barangay. Philippine Statistics Authority. Retrieved 20 June 2016.
- ^ Censuses of Population (1903–2007). "Region VII (Central Visayas)". Table 1. Population Enumerated in Various Censuses by Province/Highly Urbanized City: 1903 to 2007. National Statistics Office.
- ^ "Province of Siquijor". Municipality Population Data. Local Water Utilities Administration Research Division. Retrieved 17 December 2016.
- ^ "Poverty incidence (PI):". Philippine Statistics Authority. Retrieved December 28, 2020.
- ^ "Estimation of Local Poverty in the Philippines" (PDF). Philippine Statistics Authority. 29 November 2005.
- ^ "2003 City and Municipal Level Poverty Estimates" (PDF). Philippine Statistics Authority. 23 March 2009.
- ^ "City and Municipal Level Poverty Estimates; 2006 and 2009" (PDF). Philippine Statistics Authority. 3 August 2012.
- ^ "2012 Municipal and City Level Poverty Estimates" (PDF). Philippine Statistics Authority. 31 May 2016.
- ^ "Municipal and City Level Small Area Poverty Estimates; 2009, 2012 and 2015". Philippine Statistics Authority. 10 July 2019.
- ^ "PSA Releases the 2018 Municipal and City Level Poverty Estimates". Philippine Statistics Authority. 15 December 2021. Retrieved 22 January 2022.
- ^ "PSA Releases the 2021 City and Municipal Level Poverty Estimates". Philippine Statistics Authority. 2 April 2024. Retrieved 28 April 2024.
External links
Wikimedia Commons has media related to Maria.
Places adjacent to Maria, Siquijor | ||||||||||||||||
|---|---|---|---|---|---|---|---|---|---|---|---|---|---|---|---|---|
| ||||||||||||||||
Siquijor (capital and largest municipality) | |
| Municipalities | |
.svg.png)