North Somerset Council elections
North Somerset Council is the local authority for the unitary authority of North Somerset, England. Until 1 April 1996 it was a non-metropolitan district called Woodspring, in the county of Avon.
Council elections
| Political group | Councillors | |||||||
|---|---|---|---|---|---|---|---|---|
| 2003 | 2007 | 2011 | 2015 | 2019 | 2023[1] | Current | ||
| Conservative | 24 | 43 | 42 | 36 | 13 | 13 | 13 | |
| Independent | 3 | 6 | 7 | 6 | 12 | 8 | 7 | |
| Liberal Democrat | 23 | 5 | 6 | 4 | 10 | 9 | 9 | |
| Labour | 10 | 3 | 5 | 3 | 6 | 10 | 10 | |
| Green | 1 | 1 | 1 | 1 | 4 | 7 | 8 | |
| Portishead Independents | - | - | - | - | 4 | 3 | 3 | |
| Total | 61 | 61 | 61 | 50 | 50 | 50 | 50 | |
Non-metropolitan district elections
- 1973 Woodspring District Council election
- 1976 Woodspring District Council election
- 1979 Woodspring District Council election (New ward boundaries)[2]
- 1980 Woodspring District Council election
- 1982 Woodspring District Council election
- 1983 Woodspring District Council election (District boundary changes took place but the number of seats remained the same)[3]
- 1984 Woodspring District Council election (District boundary changes took place but the number of seats remained the same)[4]
- 1986 Woodspring District Council election
- 1987 Woodspring District Council election
- 1991 Woodspring District Council election (District boundary changes took place but the number of seats remained the same)[5]
- 1995 Woodspring District Council election
Unitary authority elections
- 1999 North Somerset Council election (New ward boundaries increased the number of seats by 2)[6][7][8]
- 2003 North Somerset Council election
- 2007 North Somerset Council election
- 2011 North Somerset Council election (New ward boundaries)[9]
- 2015 North Somerset Council election (New ward boundaries)[10]
- 2019 North Somerset Council election
- 2023 North Somerset Council election
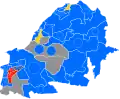
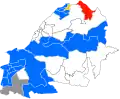
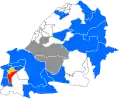
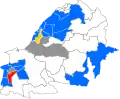
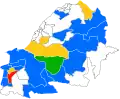
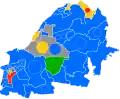
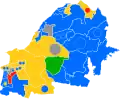
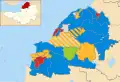
District result maps
-
 1979 results map
 -
 1980 results map
 -
 1982 results map
 -
 1983 results map
 -
 1984 results map
 -
 1985 results map
 -
 1987 results map
 -
 1991 results map
 -
 1999 results map
 -
 2003 results map
 -
 2007 results map
 -
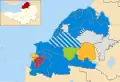 2011 results map
 -
 2015 results map
 -
 2019 results map
 -
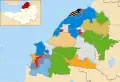 2023 results map
By-election results
1995–1999
| Party | Candidate | Votes | % | ±% | |
|---|---|---|---|---|---|
| Labour | 1,232 | 58.1 | |||
| Liberal Democrats | 635 | 30.0 | |||
| Conservative | 178 | 8.4 | |||
| Independent | 74 | 3.5 | |||
| Majority | 597 | 28.1 | |||
| Turnout | 2,119 | 35.8 | |||
| Labour hold | Swing | ||||
1999–2003
| Party | Candidate | Votes | % | ±% | |
|---|---|---|---|---|---|
| Conservative | Ian Porter | 279 | 32.7 | −20.9 | |
| Liberal Democrats | Michael Bibb | 229 | 26.8 | −3.0 | |
| Independent | Anthony Horry | 196 | 23.0 | +23.0 | |
| Labour | Stephen Lyall | 149 | 17.5 | +1.0 | |
| Majority | 50 | 5.9 | |||
| Turnout | 853 | 36.0 | |||
| Conservative hold | Swing | ||||
| Party | Candidate | Votes | % | ±% | |
|---|---|---|---|---|---|
| Liberal Democrats | Mike Bell | 811 | 44.4 | +8.2 | |
| Conservative | Clive Webb | 651 | 35.9 | −9.0 | |
| Independent | Malcolm Timmis | 205 | 11.2 | +11.2 | |
| Labour | Chris Belton-Reed | 161 | 8.8 | −10.7 | |
| Majority | 160 | 8.5 | |||
| Turnout | 1,828 | 25.4 | |||
| Liberal Democrats gain from Conservative | Swing | ||||
| Party | Candidate | Votes | % | ±% | |
|---|---|---|---|---|---|
| Liberal Democrats | Peter Kehoe | 593 | 29.2 | −4.7 | |
| Conservative | Stanley Vyce | 534 | 26.3 | +6.7 | |
| Independent | Ralph James | 496 | 24.4 | −10.7 | |
| Labour | Douglas May | 410 | 20.2 | +8.8 | |
| Majority | 59 | 2.9 | |||
| Turnout | 2,033 | 29.2 | |||
| Liberal Democrats hold | Swing | ||||
2003–2007
| Party | Candidate | Votes | % | ±% | |
|---|---|---|---|---|---|
| Conservative | Carl Francis-Pester | 431 | 44.3 | −17.1 | |
| Liberal Democrats | Wendy Griggs | 369 | 37.9 | +15.0 | |
| Labour | Derek Waters | 174 | 17.9 | +2.2 | |
| Majority | 62 | 6.4 | |||
| Turnout | 974 | 44.0 | |||
| Conservative hold | Swing | ||||
| Party | Candidate | Votes | % | ±% | |
|---|---|---|---|---|---|
| Liberal Democrats | Michael Johnston | 476 | 43.8 | +4.0 | |
| Conservative | David Pasley | 434 | 39.9 | −20.3 | |
| UKIP | Anthony Butcher | 118 | 10.8 | +10.8 | |
| Labour | 59 | 5.4 | +5.4 | ||
| Majority | 42 | 3.9 | |||
| Turnout | 1,087 | 45.5 | |||
| Liberal Democrats gain from Conservative | Swing | ||||
| Party | Candidate | Votes | % | ±% | |
|---|---|---|---|---|---|
| Conservative | David Jolley | 488 | 38.9 | +20.8 | |
| Liberal Democrats | Jean Lord | 452 | 36.1 | +36.1 | |
| Labour | Patricia Gardener | 205 | 16.4 | +16.4 | |
| Independent | Reyna Knight | 108 | 8.6 | −73.3 | |
| Majority | 36 | 2.8 | |||
| Turnout | 1,253 | 49.0 | |||
| Conservative gain from Independent | Swing | ||||
| Party | Candidate | Votes | % | ±% | |
|---|---|---|---|---|---|
| Liberal Democrats | Wendy Griggs | 812 | 31.1 | +1.3 | |
| Independent | Anthony Moulin | 749 | 28.7 | −5.8 | |
| Conservative | Jill Iles | 678 | 26.0 | +3.5 | |
| Independent | Hilary Burn | 267 | 10.2 | +10.2 | |
| Labour | Bryan Moore | 104 | 4.0 | −9.1 | |
| Majority | 63 | 2.4 | |||
| Turnout | 2,610 | 38.4 | |||
| Liberal Democrats gain from Independent | Swing | ||||
| Party | Candidate | Votes | % | ±% | |
|---|---|---|---|---|---|
| Independent | Nanette Kirsen | 360 | 33.9 | +33.9 | |
| Labour | Pauline Robertson | 353 | 33.2 | −28.0 | |
| Liberal Democrats | David Neale | 202 | 19.0 | +3.4 | |
| Conservative | Anne-Marie Gregory | 147 | 13.8 | −9.3 | |
| Majority | 7 | 0.7 | |||
| Turnout | 1,062 | 40.0 | |||
| Independent gain from Labour | Swing | ||||
2007–2011
| Party | Candidate | Votes | % | ±% | |
|---|---|---|---|---|---|
| Conservative | Philip Judd | 946 | |||
| Conservative | Steven Edwards | 920 | |||
| Conservative | Marcia Pepperall | 904 | |||
| Liberal Democrats | Ronald Moon | 513 | |||
| Liberal Democrats | Richard Skinner | 498 | |||
| Liberal Democrats | Peter Hardaway | 494 | |||
| Labour | Barbara Francis | 268 | |||
| Labour | Brian Grace | 234 | |||
| Labour | Simon Stokes | 218 | |||
| Independent | Laurence Orme | 157 | |||
| UKIP | Mary Brown | 154 | |||
| Turnout | 5,306 | 26.6 | |||
| Conservative gain from Liberal Democrats | Swing | ||||
| Conservative gain from Liberal Democrats | Swing | ||||
| Conservative gain from Liberal Democrats | Swing | ||||
| Party | Candidate | Votes | % | ±% | |
|---|---|---|---|---|---|
| Conservative | Amratlal Patel | 478 | 27.5 | −33.6 | |
| Independent | John Ley-Morgan | 477 | 27.5 | +27.5 | |
| Liberal Democrats | Paula Howell | 421 | 24.3 | −4.1 | |
| Independent | Sidney Carter | 228 | 13.1 | +13.1 | |
| Labour | Josephine Bateman | 132 | 7.6 | −2.9 | |
| Majority | 1 | 0.1 | |||
| Turnout | 1,736 | 24.6 | |||
| Conservative hold | Swing | ||||
| Party | Candidate | Votes | % | ±% | |
|---|---|---|---|---|---|
| Conservative | Terence Porter | 1,411 | 64.9 | −4.2 | |
| Liberal Democrats | Jennifer Bindon | 511 | 23.5 | +2.8 | |
| Labour | Timothy Taylor | 253 | 11.6 | +1.4 | |
| Majority | 900 | 41.4 | |||
| Turnout | 2,175 | 42.7 | |||
| Conservative hold | Swing | ||||
2011–2015
| Party | Candidate | Votes | % | ±% | |
|---|---|---|---|---|---|
| Independent | Geoff Coombs | 816 | 61.7 | ||
| Conservative | Peter Burden | 314 | 23.7 | ||
| Labour | Terry Connell | 124 | 9.4 | ||
| Liberal Democrats | Nick Alderton | 69 | 5.2 | ||
| Majority | 502 | 37.9 | |||
| Turnout | 1,323 | 28.3 | |||
| Independent hold | Swing | ||||
| Party | Candidate | Votes | % | ±% | |
|---|---|---|---|---|---|
| Labour | James Clayton | 1,044 | 55.0 | −0.5 | |
| UKIP | Louis Rostill | 449 | 23.6 | +23.6 | |
| Liberal Democrats | Rachel Ling | 214 | 11.3 | −3.2 | |
| Conservative | John Butler | 192 | 10.1 | −12.7 | |
| Majority | 595 | 31.3 | |||
| Turnout | 1,899 | ||||
| Labour hold | Swing | ||||
| Party | Candidate | Votes | % | ±% | |
|---|---|---|---|---|---|
| Independent | Derek Mead | 531 | 25.5 | +25.5 | |
| Conservative | Richard Nightingale | 471 | 22.6 | −27.5 | |
| Labour | Denise Hunt | 445 | 21.4 | −1.9 | |
| Liberal Democrats | Edward Keating | 321 | 15.4 | −11.2 | |
| UKIP | Steven Pearse-Danker | 220 | 10.6 | +10.6 | |
| Independent | Rachel Ling | 93 | 4.5 | +4.5 | |
| Majority | 60 | 2.9 | |||
| Turnout | 2,081 | ||||
| Independent gain from Conservative | Swing | ||||
2015–2019
| Party | Candidate | Votes | % | ±% | |
|---|---|---|---|---|---|
| Labour | Denise Estelle Hunt | 589 | 36.4 | ||
| Conservative | James Davies | 525 | 32.4 | ||
| Liberal Democrats | Alan Stuart Rice | 265 | 16.4 | ||
| Independent | Richard Geoffrey Skinner | 132 | 8.2 | ||
| UKIP | Anita Christine Maria Spencer-Johns | 108 | 6.7 | ||
| Majority | 64 | 0.4 | |||
| Turnout | 1,619 | 25.6 | |||
| Labour gain from North Somerset First Independents | |||||
2019–2023
| Party | Candidate | Votes | % | ±% | |
|---|---|---|---|---|---|
| Portishead Ind. | Caroline Davinia Goddard | 768 | 40.4 | −30.6 | |
| Conservative | David Harry Collingwood Oyns | 609 | 32.1 | +14.7 | |
| Liberal Democrats | Paul Anthony Welton | 303 | 16.0 | N/A | |
| Labour | Sophie Ann Davies | 219 | 11.5 | +3.2 | |
| Turnout | 1,899 | 34.15 | –1.81 | ||
| Registered electors | 5,701 | ||||
| Portishead Ind. hold | Swing | ||||
| Party | Candidate | Votes | % | ±% | |
|---|---|---|---|---|---|
| Green | Phil Neve | 594 | 64.5 | N/A | |
| Conservative | Samantha Pepperall | 270 | 29.3 | +15.7 | |
| Labour | Dawn Parry | 57 | 6.2 | −25.8 | |
| Majority | 324 | 35.2 | N/A | ||
| Turnout | 922 | 28.6 | −10.7 | ||
| Green gain from Liberal Democrats | Swing | ||||
2023-2027
| Party | Candidate | Votes | % | ±% | |
|---|---|---|---|---|---|
| Green | Thomas Daw | 336 | 32.7 | N/A | |
| Conservative | Annabel Tall | 297 | 28.9 | +6.8 | |
| Liberal Democrats | Samantha Louden-Cooke | 283 | 27.5 | N/A | |
| Labour | Steven Lister | 112 | 10.9 | N/A | |
| Majority | 39 | 3.8 | |||
| Turnout | 1,028 | ||||
| Green gain from Independent | |||||
References
- ^ "No party has won a majority in North Somerset". BBC News. BBC. 5 May 2023. Retrieved 8 May 2023.
- ^ The District of Woodspring (Electoral Arrangements) Order 1977
- ^ The Avon and Somerset (Areas) Order 1983
- ^ The Bristol, Wansdyke and Woodspring (Areas) Order 1984
- ^ legislation.gov.uk – The Avon, Somerset and Wiltshire (County Boundaries) Order 1990. Retrieved on 5 November 2015.
- ^ legislation.gov.uk – The District of North Somerset (Electoral Changes) Order 1998. Retrieved on 4 October 2015.
- ^ "North Somerset". BBC News Online. Retrieved 14 August 2011.
- ^ "Political and committee structure". North Somerset Council. Retrieved 14 August 2011.
- ^ legislation.gov.uk – The North Somerset (Electoral Changes) Order 2010. Retrieved on 3 November 2015.
- ^ legislation.gov.uk – The North Somerset (Electoral Changes) Order 2014. Retrieved on 3 November 2015.
- ^ "Kewstoke By-Election Result". North Somerset Council. Archived from the original on 17 August 2003. Retrieved 14 August 2011.
- ^ "Weston By Election Result". North Somerset Council. Archived from the original on 8 July 2003. Retrieved 14 August 2011.
- ^ "Tories win Richmondshire". guardian.co.uk. 26 October 2001. Retrieved 14 August 2011.
- ^ "Sons of Cornwall make sole byelection gain". guardian.co.uk. 12 November 2004. Retrieved 14 August 2011.
- ^ a b "Tories make byelection gains". guardian.co.uk. 2 June 2006. Retrieved 14 August 2011.
- ^ "Labour slumps in council byelections". guardian.co.uk. 8 September 2006. Retrieved 14 August 2011.
- ^ "Declaration of result of poll" (PDF). North Somerset District Council. Retrieved 14 August 2011.
- ^ "Declaration of result of poll" (PDF). North Somerset Council. Retrieved 14 August 2011.
- ^ "Election results". North Somerset Council. Retrieved 14 August 2011.
- ^ "Elections and voting". North Somerset Council. Retrieved 9 September 2011.
- ^ "Local Elections Archive Project — Weston-super-Mare South Ward". www.andrewteale.me.uk. Retrieved 12 July 2024.
- ^ "Local Elections Archive Project — Weston-super-Mare South Ward". www.andrewteale.me.uk. Retrieved 12 July 2024.
- ^ Brain, Nicholas (1 September 2017). "North Worle by-election" (PDF). North Somerset Council. Retrieved 1 September 2017.
- ^ "Declaration of result of poll" (PDF). n-somerset.gov.uk. Retrieved 11 March 2023.
- ^ "Local Elections Archive Project — Wrington Ward". www.andrewteale.me.uk. Retrieved 12 July 2024.
External links
| Somerset Council | |||||||||||||||||||||
|---|---|---|---|---|---|---|---|---|---|---|---|---|---|---|---|---|---|---|---|---|---|
| Bath and North East Somerset Council | |||||||||||||||||||||
| West of England Mayor | |||||||||||||||||||||
| |||||||||||||||||||||
| |||||||||||||||||||||