Pčinja District
Pčinja District
Пчињски округ | |
|---|---|
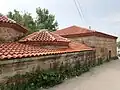   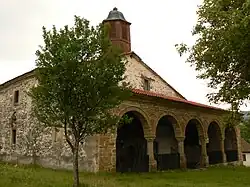 .JPG)  .jpg) 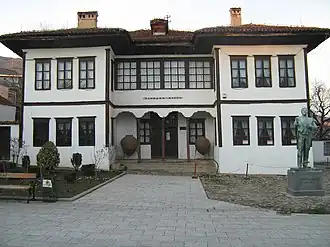 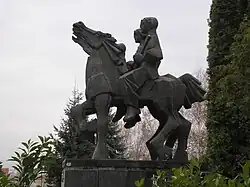 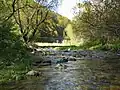 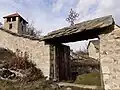 .jpg) 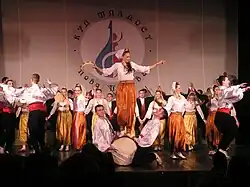 .JPG) .jpg) 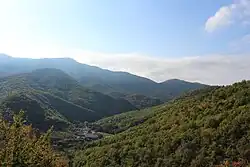 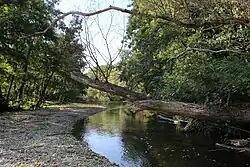 Images from the Pčinja District | |
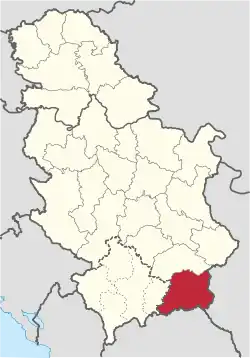 Location of district in Serbia | |
| Coordinates: 42°33′N 21°54′E / 42.550°N 21.900°E | |
| Country | |
| Administrative center | Vranje |
| Government | |
| • Commissioner | Srećko Pejković |
| Area | |
• Total | 3,520 km2 (1,360 sq mi) |
| Population (2022)[1] | |
• Total | 193,802 |
| • Density | 55/km2 (140/sq mi) |
| ISO 3166 code | RS-24 |
| Municipalities | 6 and 1 city |
| Settlements | 363 |
| – Cities and towns | 6 |
| – Villages | 357 |
| Website | www |
The Pčinja District (Serbian: Пчињски округ, romanized: Pčinjski okrug, pronounced [ptʃǐɲskiː ôkruːɡ]) is one of administrative districts of Serbia. It occupies the southernmost part of the country. According to the 2022 census, it has a population of 193,802 inhabitants. The administrative center of the Pčinja District is the city of Vranje.
History
The present-day administrative districts (including Pčinja District) were established in 1992 by the decree of the Government of Serbia.
Cities and municipalities
The district encompasses one city and seven municipalities:
- Vranje (city)
- Bosilegrad (municipality)
- Bujanovac (municipality)
- Preševo (municipality)
- Surdulica (municipality)
- Trgovište (municipality)
- Vladičin Han (municipality)
- Vranjska Banja (municipality)
Demographics
| Year | Pop. | ±% |
|---|---|---|
| 1948 | 209,232 | — |
| 1953 | 220,910 | +5.6% |
| 1961 | 222,520 | +0.7% |
| 1971 | 230,373 | +3.5% |
| 1981 | 238,753 | +3.6% |
| 1991 | 243,529 | +2.0% |
| 2002 | 227,690 | −6.5% |
| 2011[a] | 159,081 | −30.1% |
| 2021 | 193,802 | +21.8% |
| Source: [2][1] | ||
Towns
There are three towns with over 10,000 inhabitants.
Ethnic structure
| Ethnicity | Population[3] | Percentage |
|---|---|---|
| Serbs | 112,011 | 57.8% |
| Albanians | 56,834 | 29.3% |
| Roma | 10,877 | 5.6% |
| Bulgarians | 4,970 | 2.5% |
| Others | 1,711 | 0.9% |
| Undeclared/Unknown | 8,102 | 4.2% |
See also
References
- ^ a b "Prvi rezultati Popisa stanovništva, domaćinstava i stanova 2022". stat.gov.rs (in Serbian). 21 December 2022. Retrieved 16 February 2023.
d
- ^ "2011 Census of Population, Households and Dwellings in the Republic of Serbia" (PDF). stat.gov.rs. Statistical Office of the Republic of Serbia. Retrieved 11 January 2017.
- ^ "Ethnicity - Data by municipalities and cities" (PDF). publikacije.stat.gov.rs.
- Note: All official material made by the Government of Serbia is public by law. Information was taken from the official website.
External links
Wikimedia Commons has media related to Pčinja District.
Places adjacent to Pčinja District | ||||||||||||||||
|---|---|---|---|---|---|---|---|---|---|---|---|---|---|---|---|---|
| ||||||||||||||||