Penwith District Council elections
Penwith was a non-metropolitan district in Cornwall, England. It was abolished on 1 April 2009 and replaced by Cornwall Council.
Political control
The first election to the council was held in 1973, initially operating as a shadow authority before coming into its powers on 1 April 1974. Political control of the council from 1973 until the council's abolition in 2009 was held by the following parties:[1]
| Party in control | Years | |
|---|---|---|
| Independent | 1973–1986 | |
| No overall control | 1986–2009 | |
Council elections
- 1973 Penwith District Council election
- 1976 Penwith District Council election
- 1979 Penwith District Council election (New ward boundaries)[2]
- 1980 Penwith District Council election
- 1982 Penwith District Council election
- 1983 Penwith District Council election
- 1984 Penwith District Council election
- 1986 Penwith District Council election
- 1987 Penwith District Council election
- 1988 Penwith District Council election
- 1990 Penwith District Council election
- 1991 Penwith District Council election
- 1992 Penwith District Council election
- 1994 Penwith District Council election
- 1995 Penwith District Council election
- 1996 Penwith District Council election
- 1998 Penwith District Council election
- 1999 Penwith District Council election
- 2000 Penwith District Council election
- 2002 Penwith District Council election
- 2003 Penwith District Council election
- 2004 Penwith District Council election (New ward boundaries)[3]
- 2006 Penwith District Council election
- 2007 Penwith District Council election
Results maps
-
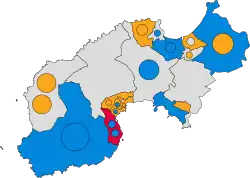 2004 results map
 -
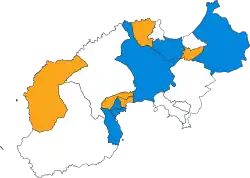 2006 results map
 -
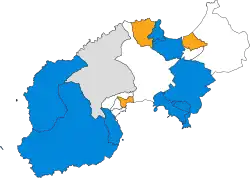 2007 results map
By-election results
| Party | Candidate | Votes | % | ±% | |
|---|---|---|---|---|---|
| Labour | 655 | 40.4 | |||
| Liberal Democrats | 426 | 26.4 | |||
| Conservative | 425 | 26.2 | |||
| Independent | 117 | 7.2 | |||
| Majority | 229 | 14.0 | |||
| Turnout | 1,623 | ||||
| Labour hold | Swing | ||||
| Party | Candidate | Votes | % | ±% | |
|---|---|---|---|---|---|
| Conservative | 275 | 39.9 | |||
| Liberal Democrats | 267 | 38.7 | |||
| Labour | 148 | 21.4 | |||
| Majority | 8 | 1.2 | |||
| Turnout | 690 | 24.8 | |||
| Conservative gain from Independent | Swing | ||||
| Party | Candidate | Votes | % | ±% | |
|---|---|---|---|---|---|
| Liberal Democrats | 442 | 39.0 | −11.4 | ||
| Independent | 318 | 28.1 | +28.1 | ||
| Labour | 223 | 19.7 | −29.9 | ||
| Conservative | 149 | 13.2 | +13.2 | ||
| Majority | 124 | 10.9 | |||
| Turnout | 1,132 | ||||
| Liberal Democrats hold | Swing | ||||
| Party | Candidate | Votes | % | ±% | |
|---|---|---|---|---|---|
| Conservative | 650 | 70.8 | +24.7 | ||
| Liberal Democrats | 268 | 29.2 | −7.1 | ||
| Majority | 382 | 41.6 | |||
| Turnout | 918 | 27.8 | |||
| Conservative hold | Swing | ||||
| Party | Candidate | Votes | % | ±% | |
|---|---|---|---|---|---|
| Liberal Democrats | 687 | 50.1 | +18.8 | ||
| Conservative | 426 | 31.1 | +31.1 | ||
| Labour | 258 | 18.8 | +18.8 | ||
| Majority | 261 | 19.0 | |||
| Turnout | 1,371 | 28.7 | |||
| Liberal Democrats hold | Swing | ||||
| Party | Candidate | Votes | % | ±% | |
|---|---|---|---|---|---|
| Conservative | Eric Care | 1,245 | 67.3 | +5.2 | |
| Independent | Joby Jackson | 606 | 32.7 | +32.7 | |
| Majority | 639 | 34.6 | |||
| Turnout | 1,851 | ||||
| Conservative hold | Swing | ||||
| Party | Candidate | Votes | % | ±% | |
|---|---|---|---|---|---|
| Conservative | Robert Stokes | 351 | 37.1 | +6.5 | |
| Liberal Democrats | Simon Reed | 330 | 34.9 | +34.9 | |
| Labour | Timothy Pullen | 191 | 20.2 | −1.9 | |
| Independent | Malcolm Lawrence | 53 | 5.6 | −19.8 | |
| Independent | Joby Akira | 20 | 2.1 | −10.2 | |
| Majority | 21 | 2.2 | |||
| Turnout | 945 | 34.8 | |||
| Conservative hold | Swing | ||||
| Party | Candidate | Votes | % | ±% | |
|---|---|---|---|---|---|
| Conservative | 685 | 56.7 | |||
| Independent | 264 | 21.8 | |||
| Labour | 125 | 10.3 | |||
| Independent | 119 | 9.8 | |||
| Independent | 16 | 1.3 | |||
| Majority | 421 | 34.9 | |||
| Turnout | 1,209 | 46.2 | |||
| Conservative hold | Swing | ||||
| Party | Candidate | Votes | % | ±% | |
|---|---|---|---|---|---|
| Liberal Democrats | Jan Ruhrmund | 454 | 39.4 | ||
| Conservative | Samuel Ryan | 451 | 39.2 | ||
| Labour | Timothy Pullen | 150 | 13.0 | ||
| Independent | Malcolm Lawrence | 90 | 7.8 | ||
| Independent | Joby Akira | 6 | 0.5 | ||
| Majority | 3 | 0.2 | |||
| Turnout | 1,151 | 42.1 | |||
| Liberal Democrats hold | Swing | ||||
| Party | Candidate | Votes | % | ±% | |
|---|---|---|---|---|---|
| Independent | John Bennett | 374 | 67.4 | +14.3 | |
| Labour | Jayne Ninnes | 181 | 32.6 | +19.3 | |
| Majority | 193 | 34.8 | |||
| Turnout | 555 | 19.7 | |||
| Independent hold | Swing | ||||
| Party | Candidate | Votes | % | ±% | |
|---|---|---|---|---|---|
| Conservative | Derek Thomas | 223 | 29.5 | −6.5 | |
| Liberal Democrats | Mark Squire | 208 | 27.5 | −18.7 | |
| Labour | Cornelius Olivier | 195 | 25.8 | +8.0 | |
| Mebyon Kernow | Phillip Rendle | 92 | 12.1 | +12.1 | |
| Independent | Stephen Dicker | 38 | 5.0 | +5.0 | |
| Majority | 15 | 2.0 | |||
| Turnout | 756 | 26.2 | |||
| Conservative gain from Liberal Democrats | Swing | ||||
| Party | Candidate | Votes | % | ±% | |
|---|---|---|---|---|---|
| Conservative | Ray Tovey | 493 | 57.7 | +4.6 | |
| Independent | Derek Elliott | 192 | 22.5 | +22.5 | |
| Labour | Jayne Ninnes | 170 | 19.9 | +19.9 | |
| Majority | 301 | 35.2 | |||
| Turnout | 855 | 27.1 | |||
| Conservative hold | Swing | ||||
References
- ^ "Compositions Calculator". The Elections Centre. University of Exeter. Retrieved 26 November 2024. (Put "Penwith" in search box to see specific results.)
- ^ The District of Penwith (Electoral Arrangements) Order 1978
- ^ legislation.gov.uk - The District of Penwith (Electoral Changes) Order 2002. Retrieved on 4 October 2015.
External links
| Cornwall Council | |
|---|---|
| Council of the Isles of Scilly | |
| Caradon District Council |
|
| Carrick District Council |
|
| Kerrier District Council |
|
| North Cornwall District Council |
|
| Restormel Borough Council | |
| |