Rouville Regional County Municipality
Rouville | |
|---|---|
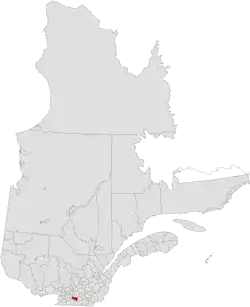 Location in province of Quebec. | |
| Coordinates: 45°26′N 73°03′W / 45.433°N 73.050°W[1] | |
| Country | |
| Province | |
| Region | Montérégie |
| Effective | January 1, 1982 |
| County seat | Marieville |
| Government | |
| • Type | Prefecture |
| • Prefect | Michel Picotte |
| Area | |
• Total | 490.10 km2 (189.23 sq mi) |
| • Land | 483.12 km2 (186.53 sq mi) |
| Population (2016)[3] | |
• Total | 36,536 |
| • Density | 75.6/km2 (196/sq mi) |
| • Change 2011-2016 | |
| • Dwellings | 15,470 |
| Time zone | UTC−5 (EST) |
| • Summer (DST) | UTC−4 (EDT) |
| Area codes | 450 and 579 |
| Website | www |
Rouville (French pronunciation: [ʁuvil]) is a regional county municipality in the Montérégie region of Quebec, Canada. Its seat is Marieville.
Subdivisions
There are 8 subdivisions within the RCM:[2]
|
|
Demographics
Population
Canada census – Rouville community profile
| 2021 | 2016 | 2011 | |
|---|---|---|---|
| Population | 37,889 (+3.7% from 2016) | 36,536 (+2.4% from 2011) | 35,690 (+13.8% from 2006) |
| Land area | 482.80 km2 (186.41 sq mi) | 483.12 km2 (186.53 sq mi) | 483.21 km2 (186.57 sq mi) |
| Population density | 78.5/km2 (203/sq mi) | 75.6/km2 (196/sq mi) | 73.9/km2 (191/sq mi) |
| Median age | 42 (M: 42, F: 42) | 40.8 (M: 40.5, F: 41.2) | 40.1 (M: 39.6, F: 40.6) |
| Private dwellings | 15,755 (total) | 15,470 (total) | 14,819 (total) |
| Median household income | $65,186 | $57,354 |
|
|
| ||||||||||||||||||||||||||||||
| [7][3]
(A) adjustment to reflect boundary change. | ||||||||||||||||||||||||||||||||
Language
| Canada Census Mother Tongue - Rouville Regional County Municipality, Quebec[7][3] | ||||||||||||||||||
|---|---|---|---|---|---|---|---|---|---|---|---|---|---|---|---|---|---|---|
| Census | Total | French
|
English
|
French & English
|
Other
| |||||||||||||
| Year | Responses | Count | Trend | Pop % | Count | Trend | Pop % | Count | Trend | Pop % | Count | Trend | Pop % | |||||
2016
|
35,880
|
34,380 | 95.8% | 660 | 1.8% | 190 | 0.5% | 650 | 1.8% | |||||||||
2011
|
35,055
|
33,755 | 96.29% | 650 | 1.86% | 190 | 0.54% | 460 | 1.31% | |||||||||
2006
|
30,820
|
29,670 | 96.27% | 580 | 1.88% | 100 | 0.32% | 470 | 1.53% | |||||||||
2001
|
29,490
|
28,565 | 96.86% | 505 | 1.71% | 170 | 0.58% | 250 | 0.85% | |||||||||
1996
|
32,685
|
31,720 | n/a | 97.05% | 500 | n/a | 1.53% | 170 | n/a | 0.52% | 295 | n/a | 0.90% | |||||
Transportation
Access Routes
Highways and numbered routes that run through the municipality, including external routes that start or finish at the county border:[8]
|
|
See also
References
- ^ "Banque de noms de lieux du Québec: Reference number 141040". toponymie.gouv.qc.ca (in French). Commission de toponymie du Québec.
- ^ a b c "Répertoire des municipalités: Geographic code 550". www.mamh.gouv.qc.ca (in French). Ministère des Affaires municipales et de l'Habitation.
- ^ a b c d "Census Profile, 2016 Census Rouville, Municipalité régionale de comté [Census division], Quebec". Statistics Canada. Retrieved November 25, 2019.
- ^ "2021 Community Profiles". 2021 Canadian census. Statistics Canada. February 4, 2022. Retrieved 2022-04-27.
- ^ "2016 Community Profiles". 2016 Canadian census. Statistics Canada. August 12, 2021. Retrieved 2019-11-25.
- ^ "2011 Community Profiles". 2011 Canadian census. Statistics Canada. March 21, 2019. Retrieved 2014-03-09.
- ^ a b Statistics Canada: 1996, 2001, 2006, 2011 census
- ^ Official Transport Quebec Road Map
Adjacent Counties & Equivalent Territories | |
|---|---|