Rovira, Tolima
Rovira | |
|---|---|
Municipality and town | |
.svg.png) Flag .svg.png) Seal | |
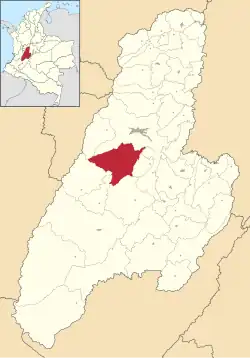 Location of the municipality and town of Rovira in the Tolima Department of Colombia. | |
| Country | |
| Department | Tolima Department |
| Government | |
| • mayor | David Yoani Vivas Barragan |
| Area | |
• Total | 818 km2 (316 sq mi) |
| Elevation | 949 m (3,114 ft) |
| Population (2017) | |
• Total | 20,452[1] |
| Time zone | UTC-5 (Colombia Standard Time) |
Rovira is a town and municipality in the Tolima department of Colombia. The population of the municipality was 21,822 as of the 1993 census.
Climate
| Climate data for Rovira (Riomanso), elevation 2,020 m (6,630 ft), (1981–2010) | |||||||||||||
|---|---|---|---|---|---|---|---|---|---|---|---|---|---|
| Month | Jan | Feb | Mar | Apr | May | Jun | Jul | Aug | Sep | Oct | Nov | Dec | Year |
| Mean daily maximum °C (°F) | 21.1 (70.0) |
21.1 (70.0) |
21.3 (70.3) |
21.7 (71.1) |
21.7 (71.1) |
21.6 (70.9) |
21.6 (70.9) |
22.1 (71.8) |
22.1 (71.8) |
21.7 (71.1) |
21.3 (70.3) |
21.4 (70.5) |
21.6 (70.9) |
| Daily mean °C (°F) | 16.7 (62.1) |
16.9 (62.4) |
17.0 (62.6) |
17.2 (63.0) |
17.2 (63.0) |
17.0 (62.6) |
16.8 (62.2) |
17.1 (62.8) |
17.2 (63.0) |
17.0 (62.6) |
16.8 (62.2) |
16.8 (62.2) |
17.0 (62.6) |
| Mean daily minimum °C (°F) | 12.3 (54.1) |
12.6 (54.7) |
12.8 (55.0) |
13.0 (55.4) |
12.9 (55.2) |
12.6 (54.7) |
12.2 (54.0) |
12.3 (54.1) |
12.6 (54.7) |
12.6 (54.7) |
12.5 (54.5) |
12.1 (53.8) |
12.5 (54.5) |
| Average precipitation mm (inches) | 97.2 (3.83) |
125.1 (4.93) |
165.7 (6.52) |
215.1 (8.47) |
213.2 (8.39) |
146.9 (5.78) |
115.6 (4.55) |
107.1 (4.22) |
151.9 (5.98) |
185.7 (7.31) |
179.6 (7.07) |
125.1 (4.93) |
1,822.2 (71.74) |
| Average precipitation days | 12 | 13 | 17 | 19 | 20 | 16 | 14 | 13 | 15 | 19 | 18 | 15 | 192 |
| Average relative humidity (%) | 89 | 89 | 90 | 90 | 89 | 88 | 87 | 87 | 86 | 88 | 90 | 89 | 88 |
| Source: Instituto de Hidrologia Meteorologia y Estudios Ambientales[2] | |||||||||||||
References
- ^ "Projections of the total national, departmental and municipal population by area 1985-2020" (XLS). NADS. Retrieved December 24, 2018.
- ^ "Promedios Climatológicos 1981–2010" (in Spanish). Instituto de Hidrologia Meteorologia y Estudios Ambientales. Archived from the original on 15 August 2016. Retrieved 17 June 2024.