Sapa-Sapa
Sapa-Sapa
ساڤ-ساڤ | |
|---|---|
| Municipality of Sapa-Sapa | |
 Flag | |
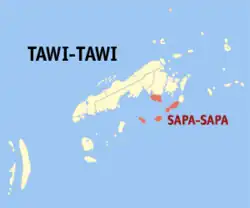 Map of Tawi-Tawi with Sapa-Sapa highlighted | |
OpenStreetMap | |
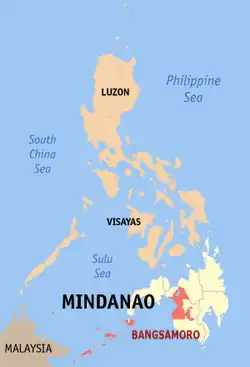
.svg.png) Sapa-Sapa Location within the Philippines | |
| Coordinates: 5°05′24″N 120°16′22″E / 5.089897°N 120.272875°E | |
| Country | Philippines |
| Region | Bangsamoro Autonomous Region in Muslim Mindanao |
| Province | Tawi-Tawi |
| District | Lone district |
| Barangays | 23 (see Barangays) |
| Government | |
| • Type | Sangguniang Bayan |
| • Mayor | Rhodesia M. Sali |
| • Vice Mayor | Karim Darwis J. Masdal |
| • Representative | Dimszar M. Sali |
| • Municipal Council | Members |
| • Electorate | 22,022 voters (2025) |
| Area | |
• Total | 235.61 km2 (90.97 sq mi) |
| Elevation | 5.0 m (16.4 ft) |
| Highest elevation | 529 m (1,736 ft) |
| Lowest elevation | 0 m (0 ft) |
| Population (2024 census)[3] | |
• Total | 37,129 |
| • Density | 160/km2 (410/sq mi) |
| • Households | 5,548 |
| Economy | |
| • Income class | 3rd municipal income class |
| • Poverty incidence | 37.19 |
| • Revenue | ₱ 204.4 million (2022) |
| • Assets | ₱ 159.3 million (2022) |
| • Expenditure | ₱ 180.2 million (2022) |
| • Liabilities | ₱ 1.407 million (2022) |
| Service provider | |
| • Electricity | Tawi Tawi Electric Cooperative (TAWELCO) |
| Time zone | UTC+8 (PST) |
| ZIP code | 7503 |
| PSGC | |
| IDD : area code | +63 (0)68 |
| Native languages | Sama Tagalog |
| Website | www |
Sapa-Sapa, officially the Municipality of Sapa-Sapa (Tagalog: Bayan ng Sapa-Sapa), is a municipality in the province of Tawi-Tawi, Philippines. According to the 2020 census, it has a population of 33,580.[5]
Geography
Barangays
Sapa-sapa is politically subdivided into 23 barangays. Each barangay consists of puroks while some have sitios.
- Baldatal - M
- Butun
- Dalo-Dalo
- Kohek
- Lakit-Lakit
- Latuan (Sunsang)
- Banaran Lookan
- Look Natoh
- Lookan Latuan
- Malanta
- Tambunan
- Sikubong
- Palatih Gadjaminah
- Pamasan
- Sapaat
- Sapa-Sapa (Poblacion)
- Sokah-sokah
- Bukut Sikubong
- Tangngah Deom Sikubong
- Tapian Bohe North
- Tapian Bohe South
- Banaran Tunggusong
- Mantabuan Sannang Hati
- Lookan Tup-Tup
- NOTE: "M" marks the Barangays located on the mainland, despite being separated by a creek.
Panampangan Island
Panampangan Island is located in the municipality of Sapa-sapa. The island itself is famous for its sandbar which is considered the longest in the Philippines.
At low tide, the sandbar connects to the nearby islet of Panampangan island.
Climate
| Climate data for Sapa-Sapa, Tawi-Tawi | |||||||||||||
|---|---|---|---|---|---|---|---|---|---|---|---|---|---|
| Month | Jan | Feb | Mar | Apr | May | Jun | Jul | Aug | Sep | Oct | Nov | Dec | Year |
| Mean daily maximum °C (°F) | 29 (84) |
29 (84) |
29 (84) |
30 (86) |
30 (86) |
30 (86) |
29 (84) |
30 (86) |
30 (86) |
30 (86) |
29 (84) |
29 (84) |
30 (85) |
| Mean daily minimum °C (°F) | 25 (77) |
24 (75) |
24 (75) |
25 (77) |
25 (77) |
25 (77) |
25 (77) |
25 (77) |
25 (77) |
25 (77) |
25 (77) |
25 (77) |
25 (77) |
| Average precipitation mm (inches) | 157 (6.2) |
115 (4.5) |
123 (4.8) |
96 (3.8) |
136 (5.4) |
120 (4.7) |
104 (4.1) |
89 (3.5) |
86 (3.4) |
131 (5.2) |
151 (5.9) |
159 (6.3) |
1,467 (57.8) |
| Average rainy days | 20.4 | 17.5 | 20.4 | 21.1 | 26.7 | 25.7 | 26.0 | 24.5 | 24.0 | 27.7 | 26.3 | 24.7 | 285 |
| Source: Meteoblue[6] | |||||||||||||
Demographics
| Year | Pop. | ±% p.a. |
|---|---|---|
| 1980 | 14,946 | — |
| 1990 | 16,173 | +0.79% |
| 1995 | 17,728 | +1.73% |
| 2000 | 26,242 | +8.77% |
| 2007 | 37,135 | +4.91% |
| 2010 | 28,781 | −8.86% |
| 2015 | 30,917 | +1.37% |
| 2020 | 33,580 | +1.75% |
| 2024 | 37,129 | +2.44% |
| Source: Philippine Statistics Authority[7][8][9][10][11] | ||
Economy
Poverty Incidence of Sapa-Sapa
10
20
30
40
50
60
70
2000
61.70 2003
48.09 2006
45.70 2009
37.25 2012
33.32 2015
28.65 2018
24.76 2021
37.19 Source: Philippine Statistics Authority[12][13][14][15][16][17][18][19] |
References
- ^ Municipality of Sapa-Sapa | (DILG)
- ^ "2015 Census of Population, Report No. 3 – Population, Land Area, and Population Density" (PDF). Philippine Statistics Authority. Quezon City, Philippines. August 2016. ISSN 0117-1453. Archived (PDF) from the original on May 25, 2021. Retrieved July 16, 2021.
- ^ "2024 Census of Population (POPCEN) Population Counts Declared Official by the President". Philippine Statistics Authority. 17 July 2025. Retrieved 18 July 2025.
- ^ "PSA Releases the 2021 City and Municipal Level Poverty Estimates". Philippine Statistics Authority. 2 April 2024. Retrieved 28 April 2024.
- ^ "2024 Census of Population (POPCEN) Population Counts Declared Official by the President". Philippine Statistics Authority. 17 July 2025. Retrieved 18 July 2025.
- ^ "Sapa-Sapa, Tawi-Tawi : Average Temperatures and Rainfall". Meteoblue. Retrieved 30 January 2019.
- ^ "2024 Census of Population (POPCEN) Population Counts Declared Official by the President". Philippine Statistics Authority. 17 July 2025. Retrieved 18 July 2025.
- ^ Census of Population (2015). Highlights of the Philippine Population 2015 Census of Population. Philippine Statistics Authority. Retrieved 20 June 2016.
- ^ Census of Population and Housing (2010). Population and Annual Growth Rates for The Philippines and Its Regions, Provinces, and Highly Urbanized Cities (PDF). National Statistics Office. Retrieved 29 June 2016.
- ^ Censuses of Population (1903–2007). Table 1. Population Enumerated in Various Censuses by Region: 1903 to 2007. National Statistics Office.
- ^ "Province of". Municipality Population Data. Local Water Utilities Administration Research Division. Retrieved 17 December 2016.
- ^ "Poverty incidence (PI):". Philippine Statistics Authority. Retrieved December 28, 2020.
- ^ "Estimation of Local Poverty in the Philippines" (PDF). Philippine Statistics Authority. 29 November 2005.
- ^ "2003 City and Municipal Level Poverty Estimates" (PDF). Philippine Statistics Authority. 23 March 2009.
- ^ "City and Municipal Level Poverty Estimates; 2006 and 2009" (PDF). Philippine Statistics Authority. 3 August 2012.
- ^ "2012 Municipal and City Level Poverty Estimates" (PDF). Philippine Statistics Authority. 31 May 2016.
- ^ "Municipal and City Level Small Area Poverty Estimates; 2009, 2012 and 2015". Philippine Statistics Authority. 10 July 2019.
- ^ "PSA Releases the 2018 Municipal and City Level Poverty Estimates". Philippine Statistics Authority. 15 December 2021. Retrieved 22 January 2022.
- ^ "PSA Releases the 2021 City and Municipal Level Poverty Estimates". Philippine Statistics Authority. 2 April 2024. Retrieved 28 April 2024.
External links
- Sapa-Sapa Profile at PhilAtlas.com
- Philippine Standard Geographic Code
- Sapa-Sapa Profile at the DTI Cities and Municipalities Competitive Index
- Philippine Census Information
Places adjacent to Sapa-Sapa | ||||||||||||||||
|---|---|---|---|---|---|---|---|---|---|---|---|---|---|---|---|---|
| ||||||||||||||||
Bongao (capital) | |
| Municipalities | |