Sirawai
Sirawai | |
|---|---|
| Municipality of Sirawai | |
 Municipal Hall | |
 Flag  Seal | |
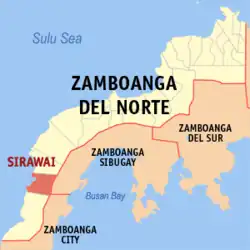 Map of Zamboanga del Norte with Sirawai highlighted | |
OpenStreetMap | |
.svg.png) Sirawai Location within the Philippines | |
| Coordinates: 7°35′07″N 122°08′26″E / 7.5853°N 122.1406°E | |
| Country | Philippines |
| Region | Zamboanga Peninsula |
| Province | Zamboanga del Norte |
| District | 3rd district |
| Barangays | 34 (see Barangays) |
| Government | |
| • Type | Sangguniang Bayan |
| • Mayor | Aljazar P. Janihim (Independent) |
| • Vice Mayor | Pulman M. Darquez (Independent) |
| • Representative | Adrian Michael A. Amatong (Liberal) |
| • Municipal Council | Members |
| • Electorate | 18,809 voters (2025) |
| Area | |
• Total | 222.50 km2 (85.91 sq mi) |
| Elevation | 88 m (289 ft) |
| Highest elevation | 536 m (1,759 ft) |
| Lowest elevation | 0 m (0 ft) |
| Population (2024 census)[3] | |
• Total | 39,836 |
| • Density | 180/km2 (460/sq mi) |
| • Households | 6,511 |
| Economy | |
| • Income class | 4th municipal income class |
| • Poverty incidence | 62.65 |
| • Revenue | ₱ 202.8 million (2022) |
| • Assets | ₱ 444 million (2022) |
| • Expenditure | ₱ 185.6 million (2022) |
| • Liabilities | ₱ 183.4 million (2022) |
| Service provider | |
| • Electricity | Zamboanga del Sur 2 Electric Cooperative (ZAMSURECO 2) |
| Time zone | UTC+8 (PST) |
| ZIP code | 7121 |
| PSGC | |
| IDD : area code | +63 (0)65 |
| Native languages | Subanon Chavacano Tagalog |
| Website | sirawai |
Sirawai, officially the Municipality of Sirawai (Cebuano: Lungsod sa Sirawai; Subanen: Benwa Sirawai; Tausūg: Kawman sin Sirawai; Zamboangueño: Municipalidad de Sirawai; Tagalog: Bayan ng Sirawai), is a municipality in the province of Zamboanga del Norte, Philippines. According to the 2020 census, it has a population of 31,163 people.[5]
Geography
Barangays
Sirawai is politically subdivided into 34 barangays. Each barangay consists of puroks while some have sitios.
- Balatakan
- Balonkan
- Balubuan
- Bitugan
- Bongon
- Catuyan
- Culasian
- Danganon
- Doña Cecilia
- Guban
- Lagundi
- Libucon
- Lubok
- Macuyon
- Minanga
- Motong
- Napulan
- Panabutan
- Piacan
- Pisa Itom
- Pisa Puti
- Piña
- Pugos
- Pula Bato
- Pulang Lupa
- Saint Mary (Poblacion)
- San Nicolas (Poblacion)
- San Roque (Poblacion)
- San Vicente (Poblacion)
- Sipakit
- Sipawa
- Sirawai Proper (Poblacion)
- Talabiga
- Tapanayan
Climate
| Climate data for Sirawai, Zamboanga del Norte | |||||||||||||
|---|---|---|---|---|---|---|---|---|---|---|---|---|---|
| Month | Jan | Feb | Mar | Apr | May | Jun | Jul | Aug | Sep | Oct | Nov | Dec | Year |
| Mean daily maximum °C (°F) | 30 (86) |
30 (86) |
31 (88) |
31 (88) |
30 (86) |
29 (84) |
29 (84) |
29 (84) |
29 (84) |
29 (84) |
30 (86) |
30 (86) |
30 (86) |
| Mean daily minimum °C (°F) | 23 (73) |
23 (73) |
24 (75) |
25 (77) |
25 (77) |
25 (77) |
24 (75) |
24 (75) |
25 (77) |
25 (77) |
24 (75) |
24 (75) |
24 (76) |
| Average precipitation mm (inches) | 98 (3.9) |
78 (3.1) |
116 (4.6) |
115 (4.5) |
222 (8.7) |
281 (11.1) |
272 (10.7) |
282 (11.1) |
237 (9.3) |
258 (10.2) |
180 (7.1) |
108 (4.3) |
2,247 (88.6) |
| Average rainy days | 19.6 | 18.6 | 21.8 | 22.9 | 29.0 | 28.6 | 28.7 | 28.3 | 27.0 | 28.6 | 25.9 | 22.1 | 301.1 |
| Source: Meteoblue[6] | |||||||||||||
Demographics
| Year | Pop. | ±% p.a. |
|---|---|---|
| 1918 | 2,289 | — |
| 1970 | 9,050 | +2.68% |
| 1975 | 9,293 | +0.53% |
| 1980 | 10,662 | +2.79% |
| 1990 | 19,911 | +6.45% |
| 1995 | 22,093 | +1.97% |
| 2000 | 16,534 | −6.02% |
| 2007 | 20,112 | +2.74% |
| 2010 | 24,583 | +7.58% |
| 2015 | 28,799 | +3.06% |
| 2020 | 31,163 | +1.67% |
| 2024 | 39,836 | +6.07% |
| Source: Philippine Statistics Authority[7][8][9][10][11] | ||
Economy
Poverty incidence of Sirawai
10
20
30
40
50
60
70
80
2000
58.22 2003
76.12 2006
65.50 2009
61.66 2012
41.50 2015
54.37 2018
57.61 2021
62.65 Source: Philippine Statistics Authority[12][13][14][15][16][17][18][19] |
References
- ^ Municipality of Sirawai | (DILG)
- ^ "2015 Census of Population, Report No. 3 – Population, Land Area, and Population Density" (PDF). Philippine Statistics Authority. Quezon City, Philippines. August 2016. ISSN 0117-1453. Archived (PDF) from the original on May 25, 2021. Retrieved July 16, 2021.
- ^ "2024 Census of Population (POPCEN) Population Counts Declared Official by the President". Philippine Statistics Authority. 17 July 2025. Retrieved 18 July 2025.
- ^ "PSA Releases the 2021 City and Municipal Level Poverty Estimates". Philippine Statistics Authority. 2 April 2024. Retrieved 28 April 2024.
- ^ "2024 Census of Population (POPCEN) Population Counts Declared Official by the President". Philippine Statistics Authority. 17 July 2025. Retrieved 18 July 2025.
- ^ "Sirawai: Average Temperatures and Rainfall". Meteoblue. Retrieved 30 April 2020.
- ^ "2024 Census of Population (POPCEN) Population Counts Declared Official by the President". Philippine Statistics Authority. 17 July 2025. Retrieved 18 July 2025.
- ^ Census of Population (2015). "Region IX (Zamboanga Peninsula)". Total Population by Province, City, Municipality and Barangay. Philippine Statistics Authority. Retrieved 20 June 2016.
- ^ Census of Population and Housing (2010). "Region IX (Zamboanga Peninsula)" (PDF). Total Population by Province, City, Municipality and Barangay. National Statistics Office. Retrieved 29 June 2016.
- ^ Censuses of Population (1903–2007). "Region IX (Zamboanga Peninsula)". Table 1. Population Enumerated in Various Censuses by Province/Highly Urbanized City: 1903 to 2007. National Statistics Office.
- ^ "Province of". Municipality Population Data. Local Water Utilities Administration Research Division. Retrieved 17 December 2016.
- ^ "Poverty incidence (PI):". Philippine Statistics Authority. Retrieved December 28, 2020.
- ^ "Estimation of Local Poverty in the Philippines" (PDF). Philippine Statistics Authority. 29 November 2005.
- ^ "2003 City and Municipal Level Poverty Estimates" (PDF). Philippine Statistics Authority. 23 March 2009.
- ^ "City and Municipal Level Poverty Estimates; 2006 and 2009" (PDF). Philippine Statistics Authority. 3 August 2012.
- ^ "2012 Municipal and City Level Poverty Estimates" (PDF). Philippine Statistics Authority. 31 May 2016.
- ^ "Municipal and City Level Small Area Poverty Estimates; 2009, 2012 and 2015". Philippine Statistics Authority. 10 July 2019.
- ^ "PSA Releases the 2018 Municipal and City Level Poverty Estimates". Philippine Statistics Authority. 15 December 2021. Retrieved 22 January 2022.
- ^ "PSA Releases the 2021 City and Municipal Level Poverty Estimates". Philippine Statistics Authority. 2 April 2024. Retrieved 28 April 2024.
External links
- Sirawai Profile at PhilAtlas.com
- Sirawai Municipality Website
- Philippine Standard Geographic Code
- Philippine Census Information
Places adjacent to Sirawai | |
|---|---|
Dipolog (capital and largest city) | |
| Municipalities | |
| Component cities | |
| Islands |
|