Tiandeng County
Tiandeng County
天等县 · Denhdwngj Yen | |
|---|---|
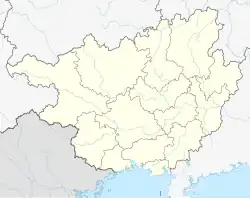 Tiandeng Location of the seat in Guangxi | |
| Coordinates: 23°04′52″N 107°08′35″E / 23.081°N 107.143°E | |
| Country | China |
| Region | Guangxi |
| Prefecture-level city | Chongzuo |
| County seat | Tiandeng Town (天等镇) |
| Area | |
• Total | 2,159 km2 (834 sq mi) |
| Elevation | 448 m (1,470 ft) |
| Population (2020) | |
• Total | 280,473 |
| • Density | 130/km2 (340/sq mi) |
| Time zone | UTC+8 (China Standard) |
| Website | www |
Tiandeng (simplified Chinese: 天等县; traditional Chinese: 天等縣; pinyin: Tiānděng Xiàn, Zhuang: Denhdwngj Yen) is a county in the southwest of Guangxi, China. It is the northernmost county-level division of the prefecture-level city of Chongzuo.
Administrative divisions
There are 6 towns and 7 townships in the county:[1]
- Towns
Tiandeng Town (天等镇), Longming Town (龙茗镇), Jinjie Town (进结镇), Xiangdu Town (向都镇), Dongping Town (东平镇), Fuxin Town (福新镇)
- Townships
Dukang Township (都康乡), Ninggan Township (宁干乡), Tuokan Township (驮堪乡), Jinyuan Township (进远乡), Shangying Township (上映乡), Bahe Township (把荷乡), Xiaoshan Township (小山乡)
Climate
| Climate data for Tiandeng, elevation 454 m (1,490 ft), (1991–2020 normals, extremes 1981–2010) | |||||||||||||
|---|---|---|---|---|---|---|---|---|---|---|---|---|---|
| Month | Jan | Feb | Mar | Apr | May | Jun | Jul | Aug | Sep | Oct | Nov | Dec | Year |
| Record high °C (°F) | 28.0 (82.4) |
33.6 (92.5) |
33.9 (93.0) |
37.3 (99.1) |
36.9 (98.4) |
36.0 (96.8) |
36.7 (98.1) |
37.0 (98.6) |
36.1 (97.0) |
33.6 (92.5) |
31.1 (88.0) |
29.2 (84.6) |
37.3 (99.1) |
| Mean daily maximum °C (°F) | 15.8 (60.4) |
18.1 (64.6) |
20.9 (69.6) |
25.8 (78.4) |
29.0 (84.2) |
30.5 (86.9) |
31.2 (88.2) |
31.2 (88.2) |
29.8 (85.6) |
26.7 (80.1) |
22.9 (73.2) |
18.3 (64.9) |
25.0 (77.0) |
| Daily mean °C (°F) | 12.2 (54.0) |
14.4 (57.9) |
17.4 (63.3) |
22.0 (71.6) |
24.9 (76.8) |
26.5 (79.7) |
26.9 (80.4) |
26.7 (80.1) |
25.0 (77.0) |
21.8 (71.2) |
18.0 (64.4) |
13.7 (56.7) |
20.8 (69.4) |
| Mean daily minimum °C (°F) | 9.7 (49.5) |
11.9 (53.4) |
15.0 (59.0) |
19.2 (66.6) |
21.9 (71.4) |
23.7 (74.7) |
24.1 (75.4) |
23.8 (74.8) |
22.0 (71.6) |
18.7 (65.7) |
14.8 (58.6) |
10.7 (51.3) |
18.0 (64.3) |
| Record low °C (°F) | 0.6 (33.1) |
1.7 (35.1) |
2.3 (36.1) |
8.1 (46.6) |
12.9 (55.2) |
16.4 (61.5) |
18.7 (65.7) |
21.1 (70.0) |
14.3 (57.7) |
9.2 (48.6) |
4.4 (39.9) |
0.2 (32.4) |
0.2 (32.4) |
| Average precipitation mm (inches) | 48.6 (1.91) |
35.7 (1.41) |
65.6 (2.58) |
71.0 (2.80) |
185.0 (7.28) |
258.9 (10.19) |
250.4 (9.86) |
233.1 (9.18) |
121.4 (4.78) |
78.9 (3.11) |
46.7 (1.84) |
37.7 (1.48) |
1,433 (56.42) |
| Average precipitation days (≥ 0.1 mm) | 13.2 | 11.9 | 15.4 | 13.7 | 15.4 | 18.3 | 18.5 | 17.6 | 12.1 | 8.9 | 8.1 | 8.7 | 161.8 |
| Average snowy days | 0.2 | 0 | 0 | 0 | 0 | 0 | 0 | 0 | 0 | 0 | 0 | 0 | 0.2 |
| Average relative humidity (%) | 78 | 77 | 80 | 78 | 78 | 82 | 82 | 82 | 80 | 78 | 77 | 75 | 79 |
| Mean monthly sunshine hours | 63.4 | 66.5 | 63.5 | 106.8 | 149.1 | 149.0 | 176.1 | 191.6 | 175.6 | 154.3 | 132.8 | 114.7 | 1,543.4 |
| Percentage possible sunshine | 19 | 21 | 17 | 28 | 36 | 37 | 43 | 48 | 48 | 43 | 40 | 35 | 35 |
| Source: China Meteorological Administration[2][3] | |||||||||||||
References
- ^ 2023年统计用区划代码和城乡划分代码:天等县 (in Simplified Chinese). National Bureau of Statistics of China.
- ^ 1991-2020 normals "Climate averages from 1991 to 2020". China Meteorological Administration. Archived from the original on 2023-04-17.
- ^ 1981-2010 extremes 中国气象数据网 – WeatherBk Data [China Meteorological Data Network - WeatherBk Data] (in Simplified Chinese). China Meteorological Administration. Retrieved 14 April 2023.
External links