Wakefield Metropolitan District Council elections
One third of Wakefield Metropolitan District Council in West Yorkshire, England is elected each year for 3 years, followed by one year without an election. 63 councillors are elected with 3 from each of the 21 wards.[1]
Council elections
- 1998 Wakefield Metropolitan District Council election
- 1999 Wakefield Metropolitan District Council election
- 2000 Wakefield Metropolitan District Council election
- 2002 Wakefield Metropolitan District Council election
- 2003 Wakefield Metropolitan District Council election
- 2004 Wakefield Metropolitan District Council election (whole council elected after boundary changes)[2]
- 2006 Wakefield Metropolitan District Council election
- 2007 Wakefield Metropolitan District Council election
- 2008 Wakefield Metropolitan District Council election
- 2010 Wakefield Metropolitan District Council election
- 2011 Wakefield Metropolitan District Council election
- 2012 Wakefield Metropolitan District Council election
- 2014 Wakefield Metropolitan District Council election
- 2015 Wakefield Metropolitan District Council election
- 2016 Wakefield Metropolitan District Council election
- 2018 Wakefield Metropolitan District Council election
- 2019 Wakefield Metropolitan District Council election
- 2021 Wakefield Metropolitan District Council election
- 2022 Wakefield Metropolitan District Council election
- 2023 Wakefield Metropolitan District Council election
- 2024 Wakefield Metropolitan District Council election
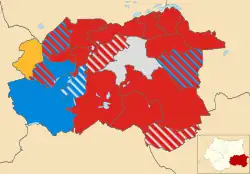
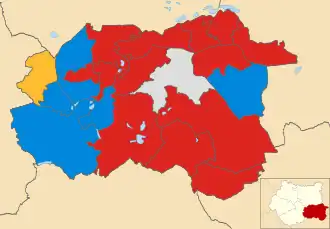
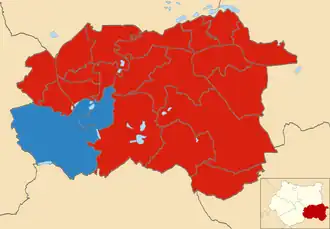
Borough result maps
-
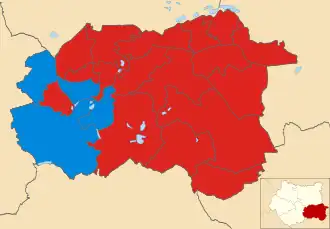
 2004 results map
 -
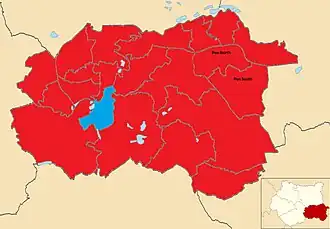
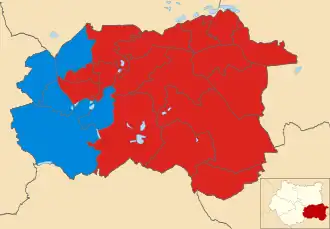
 2006 results map
 -
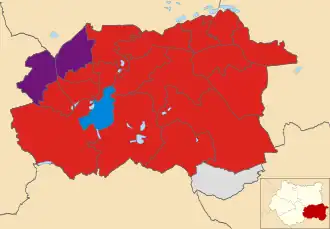
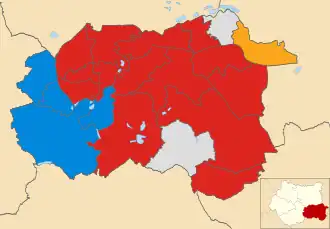
 2007 results map
 -
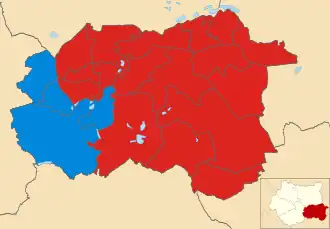
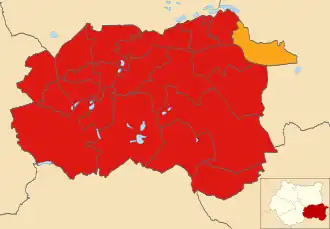
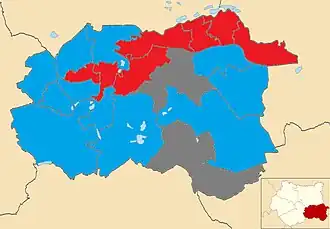 2008 results map
 -
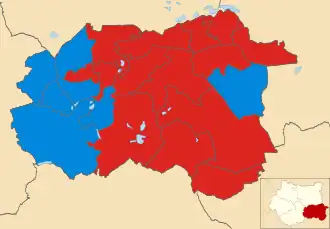 2010 results map
 -
 2011 results map
 -
 2012 results map
 -
 2014 results map
 -
 2015 results map
 -
 2016 results map
 -
 2018 results map
 -
 2019 results map
 -
 2021 results map
 -
 2022 results map
 -
 2023 results map
 -
2024 results map
By-election results
1998-2002
| Party | Candidate | Votes | % | ±% | |
|---|---|---|---|---|---|
| Labour | Tony Richardson | 988 | 49.3 | −22.8 | |
| Conservative | Kenneth Blackburn | 661 | 33.0 | +15.4 | |
| Liberal Democrats | Mark Goodair | 356 | 17.8 | +7.4 | |
| Majority | 327 | 16.3 | |||
| Turnout | 2,005 | 17.9 | |||
| Labour hold | Swing | ||||
| Party | Candidate | Votes | % | ±% | |
|---|---|---|---|---|---|
| Labour | 833 | 55.0 | +2.7 | ||
| Conservative | 511 | 37.7 | −1.7 | ||
| Liberal Democrats | Douglas Dale | 171 | 11.3 | −1.0 | |
| Majority | 322 | 17.3 | |||
| Turnout | 1,515 | 14.1 | |||
| Labour hold | Swing | ||||
2001-2009
| Party | Candidate | Votes | % | ±% | |
|---|---|---|---|---|---|
| Labour | 3,013 | 51.8 | +3.2 | ||
| Conservative | 2,004 | 34.5 | −5.3 | ||
| Liberal Democrats | Mark Goodair | 797 | 13.7 | +2.1 | |
| Majority | 1,009 | 17.3 | |||
| Turnout | 5,814 | 54.6 | |||
| Labour hold | Swing | ||||
| Party | Candidate | Votes | % | ±% | |
|---|---|---|---|---|---|
| Labour | 848 | 42.7 | +10.3 | ||
| Conservative | 605 | 30.4 | −14.6 | ||
| Liberal Democrats | Mark Goodair | 405 | 20.4 | −2.2 | |
| Independent | 69 | 3.5 | +3.5 | ||
| Independent | 60 | 3.0 | +3.0 | ||
| Majority | 243 | 12.3 | |||
| Turnout | 1,987 | 16.5 | |||
| Labour hold | Swing | ||||
2002-2006
| Party | Candidate | Votes | % | ±% | |
|---|---|---|---|---|---|
| Labour | David Watts | 1,156 | 38.2 | +9.4 | |
| Conservative | Glenn Armitage | 1,110 | 36.6 | +10.2 | |
| Liberal Democrats | Mark Goodair | 764 | 25.2 | +4.4 | |
| Majority | 46 | 1.6 | |||
| Turnout | 3,030 | 26.0 | |||
| Labour gain from Conservative | Swing | ||||
2006-2010
| Party | Candidate | Votes | % | ±% | |
|---|---|---|---|---|---|
| Labour | Les Shaw | 1,330 | 49.9 | +3.2 | |
| Liberal Democrats | Paul Kirby | 603 | 22.6 | +8.3 | |
| BNP | Stephen Rogerson | 353 | 13.3 | −7.7 | |
| Conservative | Carl Milner | 275 | 10.3 | −7.7 | |
| Independent | Jason Smart | 102 | 3.8 | +3.8 | |
| Majority | 727 | 27.3 | |||
| Turnout | 2,663 | 23.4 | |||
| Labour hold | Swing | ||||
2010-2014
| Party | Candidate | Votes | % | ±% | |
|---|---|---|---|---|---|
| Labour | Janet Holmes | 1,776 | 51.4 | +2.2% | |
| Conservative | Richard Wakefield | 1061 | 30.7 | −10.5% | |
| UKIP | David Dews | 232 | 6.7 | +6.7% | |
| Liberal Democrats | Mark Goodair | 200 | 5.8 | −3.7% | |
| Independent | Norman Tate | 93 | 2.7 | +2.7 | |
| Independent | Mark Harrop | 88 | 2.5 | +2.5 | |
| Majority | 715 | 20.7 | |||
| Turnout | 3, 454 | 28.6 | |||
| Labour gain from Conservative | Swing | ||||
| Party | Candidate | Votes | % | ±% | |
|---|---|---|---|---|---|
| Labour | Richard Forster | 1,567 | 76.7 | ||
| UKIP | Nathan Garbutt | 349 | 17.1 | ||
| Conservative | Anne-Marie Glover | 95 | 4.6 | ||
| Liberal Democrats | Mark Goodair | 33 | 1.6 | ||
| Majority | 1218 | 60.0 | |||
| Turnout | 2,044 | 16.9 | |||
| Labour hold | Swing | ||||
| Party | Candidate | Votes | % | ±% | |
|---|---|---|---|---|---|
| Labour | Rory Bickerton | 1,061 | 40.3 | −0.2% | |
| UKIP | Graham Jesty | 856 | 32.5 | +22.5 | |
| Conservative | Angela Howell | 504 | 19.1 | −3.7 | |
| Liberal Democrats | Mark Goodair | 212 | 8.1 | −0.2 | |
| Majority | 205 | 7.8 | |||
| Turnout | 2, 633 | 20.77 | |||
| Labour hold | Swing | ||||
2014-2018
| Party | Candidate | Votes | % | ±% | |
|---|---|---|---|---|---|
| Labour | Lorna Malkin | 909 | |||
| UKIP | Nathan Garbutt | 453 | |||
| Conservative | Anthony Hill | 299 | |||
| Yorkshire First | Lucy Brown | 124 | |||
| Liberal Democrats | Daniel Woodlock | 86 | |||
| TUSC | Daniel Dearden | 24 | |||
| Majority | |||||
| Turnout | |||||
| Labour hold | Swing | ||||
| Party | Candidate | Votes | % | ±% | |
|---|---|---|---|---|---|
| Labour | Jack Spencer Hemmingway | 1,353 | 51.0 | +2.4 | |
| Conservative | Nathan Garbutt Moore | 847 | 31.9 | +7.3 | |
| Liberal Democrats | Nicola Kate Sinclair | 165 | 6.2 | +2.3 | |
| Yorkshire | Lucy Victoria Brown | 153 | 5.8 | +5.8 | |
| UKIP | James Lee Johnston | 136 | 5.1 | −16.4 | |
| Majority | 506 | 19.1 | |||
| Turnout | 2,655 | 21.5 | |||
| Labour hold | Swing | ||||
| Party | Candidate | Votes | % | ±% | |
|---|---|---|---|---|---|
| Labour | Michael Paul Graham | 1,118 | 49.6 | ||
| Conservative | Dawn Lesley Hunt | 933 | 41.4 | ||
| Yorkshire | Paul Phelps | 152 | 6.7 | ||
| Liberal Democrats | Peter John Williams | 46 | 2.0 | ||
| Majority | 185 | 8.2 | |||
| Turnout | 2253 | 20.6 | |||
| Labour hold | Swing | ||||
2022-2026
| Party | Candidate | Votes | % | ±% | |
|---|---|---|---|---|---|
| Labour | Scott Haslam | 893 | 42.1 | ||
| Liberal Democrats | Christopher Howden | 548 | 25.9 | ||
| Reform UK | Waj Ali | 463 | 21.8 | ||
| Conservative | Pepe Ruzvidzo | 141 | 6.7 | ||
| Green | Alexander Wood | 74 | 3.5 | ||
| Majority | 345 | 16.3 | |||
| Turnout | 2,119 | ||||
| Labour hold | Swing | ||||
References
- ^ "How the Council Works". www.wakefield.gov.uk. Retrieved 12 August 2009.
- ^ "Wakefield council". BBC News Online. Retrieved 12 August 2009.
- ^ Mason, Christine (1998). Declaration of Result of Poll: Wakefield Central ward by-election (PDF). Wakefield Council. p. 1. Archived (PDF) from the original on 24 April 2020.
- ^ "Horbury and South Ossett No 8 ward by-election 21 April 2005 - result" (PDF). www.wakefield.gov.uk. Retrieved 12 August 2009.
- ^ a b "Labour victory in key Wakefield by-election". BBC News Online. 22 January 2010. Retrieved 22 January 2010.
- ^ [1]
- ^ [2]
- ^ [3]
- ^ [4]
- ^ [5]
- ^ "Featherstone by-election results 2024". Wakefield Council. Retrieved 18 December 2024.
- By-election results Archived 29 March 2010 at the Wayback Machine
External links
| Mayor | |
|---|---|
| Bradford | |
| Calderdale | |
| Kirklees | |
| Leeds |
|
| West Yorkshire CC | |
| West Riding CC | |
| |
