Worcestershire County Council elections
Worcestershire County Council elections are held every four years. Worcestershire County Council is the upper-tier local authority for the non-metropolitan county of Worcestershire in England. Since the last boundary changes in 2025, 57 councillors have been elected from 53 electoral divisions.[1]
Council elections
| Year | Conservative | Labour | Liberal Democrats[a] | Reform | Green | Health Concern |
UKIP | Independents & Others |
Council control after election | |
|---|---|---|---|---|---|---|---|---|---|---|
| Council re-established (57 seats) | ||||||||||
| 1997[2] | 25 | 22 | 8 | – | 0 | – | 0 | 2[b] | No overall control | |
| 2001[2] | 26 | 14 | 9 | – | 0 | 6 | 0 | 2[c] | No overall control | |
| New division boundaries | ||||||||||
| 2005[2] | 29 | 17 | 8 | – | 0 | 1 | 0 | 2[d] | Conservative | |
| 2009[2] | 42 | 3 | 8 | – | 0 | 2 | 0 | 2[e] | Conservative | |
| 2013[2] | 30 | 12 | 3 | – | 2 | 2 | 4 | 4[f] | Conservative | |
| 2017[2] | 40 | 10 | 3 | – | 2 | 1 | 0 | 1 | Conservative | |
| 2021[3] | 45 | 3 | 4 | 0 | 3 | 0 | 0 | 2 | Conservative | |
| New division boundaries[1] | ||||||||||
| 2025 | 12 | 2 | 6 | 27 | 8 | – | 0 | 2 | No overall control | |
County result maps
-
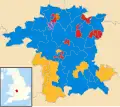 2005 results map
 -
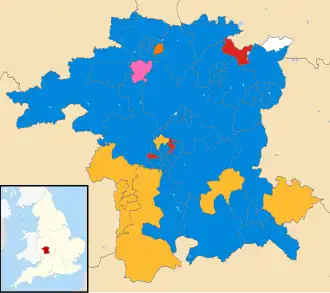 2009 results map
 -
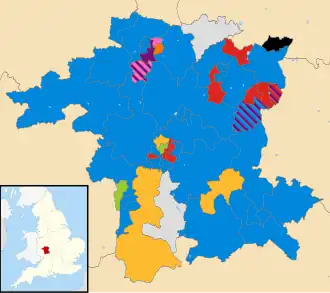 2013 results map
 -
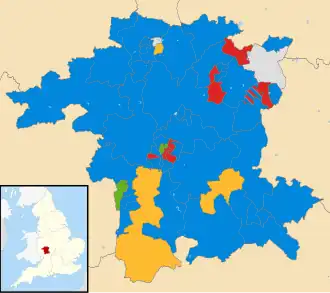 2017 results map
 -
 2021 results map
 -
 2025 results map
By-election results
2005-2009
| Party | Candidate | Votes | % | ±% | |
|---|---|---|---|---|---|
| Liberal | Graham Ballinger | 1,059 | 50.0 | +8.7 | |
| Conservative | Tracey Onslow | 672 | 31.8 | +9.6 | |
| Health Concern | Howard Martin | 252 | 11.9 | +2.4 | |
| Labour | Dan Watson | 133 | 6.3 | −13.9 | |
| Majority | 387 | 18.3 | |||
| Turnout | 2,116 | ||||
| Liberal hold | Swing | ||||
| Party | Candidate | Votes | % | ±% | |
|---|---|---|---|---|---|
| Conservative | Juliet Brunner | 1,437 | 42.2 | +9.9 | |
| Labour | Debbie Taylor | 1,041 | 30.6 | −15.8 | |
| Liberal Democrats | Diane Thomas | 455 | 13.4 | −7.9 | |
| BNP | Maurice Field | 367 | 10.8 | +10.8 | |
| Independent | Richard Armstrong | 103 | 3.0 | +3.0 | |
| Majority | 396 | 11.6 | |||
| Turnout | 3,403 | ||||
| Conservative gain from Labour | Swing | ||||
2009-2013
| Party | Candidate | Votes | % | ±% | |
|---|---|---|---|---|---|
| Conservative | Tony Miller | 1,088 | 59.2 | −1.2 | |
| Liberal Democrats | Margaret Rowley | 536 | 29.2 | +7.2 | |
| Labour | Chris Barton | 213 | 11.6 | +4.6 | |
| Majority | 552 | 30.0 | |||
| Turnout | 1,837 | ||||
| Conservative hold | Swing | ||||
| Party | Candidate | Votes | % | ±% | |
|---|---|---|---|---|---|
| Conservative | June Griffiths | 637 | 52.6 | +11.6 | |
| Labour | Christopher Bloore | 189 | 15.6 | +6.3 | |
| Independent | Dee Morton | 157 | 13.0 | +13.0 | |
| Liberal Democrats | Howard Allen | 83 | 6.9 | −6.3 | |
| Independent | Kenneth Wheatley | 79 | 6.5 | +6.5 | |
| UKIP | Steven Morson | 65 | 5.4 | −16.6 | |
| Majority | 448 | 37.0 | |||
| Turnout | 1,210 | ||||
| Conservative hold | Swing | ||||
2013-2017
| Party | Candidate | Votes | % | ±% | |
|---|---|---|---|---|---|
| Health Concern | John Thomas | 1,055 | 30.6 | +4.1 | |
| UKIP | John Holden | 892 | 25.8 | −1.7 | |
| Conservative | Chris Rogers | 753 | 21.8 | +2.3 | |
| Labour | Carol Warren | 607 | 17.6 | −5.0 | |
| Green | Angela Hartwich | 77 | 2.2 | −1.7 | |
| BNP | Carl Mason | 39 | 1.1 | +1.1 | |
| Liberal Democrats | Paul Preston | 30 | 0.9 | +0.9 | |
| Majority | 163 | 4.7 | |||
| Turnout | 3,453 | ||||
| Health Concern gain from UKIP | Swing | ||||
| Party | Candidate | Votes | % | ±% | |
|---|---|---|---|---|---|
| Conservative | Nathan Desmond | 504 | 28.0 | +2.9 | |
| UKIP | Peter Willoughby | 442 | 24.6 | −2.8 | |
| Labour | Mumshad Ahmed | 338 | 18.8 | −4.6 | |
| Health Concern | Graham Ballinger | 321 | 17.8 | +2.3 | |
| Independent | Helen Dyke | 195 | 10.8 | +10.8 | |
| Majority | 62 | 3.4 | |||
| Turnout | 1,800 | ||||
| Conservative gain from UKIP | Swing | ||||
| Party | Candidate | Votes | % | ±% | |
|---|---|---|---|---|---|
| UKIP | Peter Bridle | 2,017 | 35.2 | +1.2 | |
| Labour | Phil Mould | 1,601 | 28.0 | −1.3 | |
| Conservative | Juliet Brunner | 1,448 | 25.3 | +3.0 | |
| Liberal Democrats | Simon Oliver | 286 | 5.0 | +1.2 | |
| Green | Emma Bradley | 241 | 4.2 | +0.6 | |
| Independent | Isabel Armstrong | 133 | 2.3 | +2.3 | |
| Majority | 416 | 7.3 | |||
| Turnout | 5,726 | ||||
| UKIP hold | Swing | ||||
| Party | Candidate | Votes | % | ±% | |
|---|---|---|---|---|---|
| Conservative | Tony Muir | 763 | 28.7 | +9.2 | |
| Health Concern | Nicky Martin | 725 | 27.3 | +0.8 | |
| Labour | Jill Hawes | 581 | 21.9 | −0.7 | |
| UKIP | John Holden | 547 | 20.6 | −6.1 | |
| Green | Phil Oliver | 42 | 1.6 | −2.3 | |
| Majority | 38 | 1.4 | |||
| Turnout | 2,658 | ||||
| Conservative gain from Health Concern | Swing | ||||
| Party | Candidate | Votes | % | ±% | |
|---|---|---|---|---|---|
| Conservative | Robert Tomlinson | 956 | 63.2 | +15.2 | |
| Liberal Democrats | Peter Evans | 224 | 14.8 | +8.8 | |
| UKIP | Richard Keel | 212 | 14.0 | −19.2 | |
| Independent | Douglas Ingram | 120 | 7.9 | N/A | |
| Majority | 732 | 48.4 | |||
| Turnout | 1,518 | 18.00 | |||
| Conservative hold | Swing | ||||
2017-2021
| Party | Candidate | Votes | % | ±% | |
|---|---|---|---|---|---|
| Conservative | Kyle Daisley | 769 | 40.2 | −0.3 | |
| Independent | Rachel Jenkins | 436 | 22.8 | +22.8 | |
| Liberal Democrats | Joshua Robinson | 357 | 18.7 | +13.8 | |
| Labour | Bren Henderson | 351 | 18.3 | −32.2 | |
| Majority | 333 | 17.4 | |||
| Turnout | 1,913 | ||||
| Conservative gain from Labour | Swing | ||||
2021-2025
| Party | Candidate | Votes | % | ±% | |
|---|---|---|---|---|---|
| Labour | Andrew Fry | 1,342 | 53.7 | ||
| Conservative | Gemma Monaco | 893 | 35.7 | ||
| Green | Glen Theobald | 146 | 5.8 | ||
| Liberal Democrats | Mark Tomes | 120 | 4.8 | ||
| Majority | 449 | 18.0 | |||
| Turnout | 2,501 | 15.87 | |||
| Labour gain from Conservative | Swing | ||||
| Party | Candidate | Votes | % | ±% | |
|---|---|---|---|---|---|
| Green | Malcolm Victory | 740 | 25.4 | +25.4 | |
| Conservative | David Watkins | 737 | 25.3 | −6.3 | |
| Liberal Democrats | Pete Benkwitz | 684 | 23.5 | −13.9 | |
| Labour | Martin Willis | 388 | 13.3 | +5.0 | |
| MH Independents | Sarah Rouse | 364 | 12.5 | +12.5 | |
| Majority | 3 | 0.1 | |||
| Turnout | 2,913 | ||||
| Green gain from Liberal Democrats | Swing | ||||
| Party | Candidate | Votes | % | ±% | |
|---|---|---|---|---|---|
| Green | Andrew Cross | 1,139 | 44.1 | +28.6 | |
| Conservative | Lucy Hodgson | 623 | 24.1 | −37.0 | |
| Liberal Democrats | Sarah Murray | 579 | 22.4 | +16.2 | |
| Labour | Robyn Norfolk | 239 | 9.3 | −7.4 | |
| Majority | 516 | 20.0 | |||
| Turnout | 2,580 | ||||
| Green gain from Conservative | Swing | ||||
| Party | Candidate | Votes | % | ±% | |
|---|---|---|---|---|---|
| Conservative | Mark Goodge | 655 | 33.0 | −27.5 | |
| Labour | David Tasker | 453 | 22.8 | −1.4 | |
| Liberal Democrats | Oliver Walker | 245 | 12.3 | +3.5 | |
| Independent | John Campbell-Muir | 237 | 11.9 | +11.9 | |
| Green | Stephen Squires | 205 | 10.3 | +10.3 | |
| Independent | Peter Scurfield | 191 | 9.6 | +9.6 | |
| Majority | 202 | 10.2 | |||
| Turnout | 1,986 | ||||
| Conservative hold | Swing | ||||
See also
Notes
References
- ^ a b "The Worcestershire (Electoral Changes) Order 2024". gov.uk. 13 November 2024. Retrieved 28 April 2025.
- ^ a b c d e f "Composition calculator". Colin Rallings & Michael Thrasher. The Elections Centre, Plymouth University. Retrieved 8 May 2025.
- ^ "County Election Results 2021". Worcestershire County Council. Retrieved 28 April 2025.
- ^ Whittaker, Paul (13 April 2007). "Liberal by-election victory". Kidderminster Shuttle. Retrieved 1 June 2022.
- ^ Paine, David (19 July 2008). "Tories take by-election seat". Worcester News. Retrieved 1 June 2022.
- ^ "Local Elections Archive Project — Bowbrook Division". www.andrewteale.me.uk. Retrieved 1 June 2022.
- ^ "Local Elections Archive Project — Alvechurch Division". www.andrewteale.me.uk. Retrieved 1 June 2022.
- ^ "Local Elections Archive Project — Stourport-on-Severn Division". www.andrewteale.me.uk. Retrieved 1 June 2022.
- ^ "Local Elections Archive Project — St Marys Division". www.andrewteale.me.uk. Retrieved 1 June 2022.
- ^ "Local Elections Archive Project — Arrow Valley East Division". www.andrewteale.me.uk. Retrieved 1 June 2022.
- ^ "Local Elections Archive Project — Stourport-on-Severn Division". www.andrewteale.me.uk. Retrieved 1 June 2022.
- ^ "Local Elections Archive Project — Ombersley Division". www.andrewteale.me.uk. Retrieved 1 June 2022.
- ^ "Local Elections Archive Project — Bromsgrove South Division". www.andrewteale.me.uk. Retrieved 1 June 2022.
- ^ "Local Elections Archive Project — Arrow Valley West Division". www.andrewteale.me.uk. Retrieved 5 November 2022.
- ^ "Local Elections Archive Project — Malvern Chase Division". www.andrewteale.me.uk. Retrieved 5 November 2022.
- ^ "Local Elections Archive Project — Warndon Parish Division". www.andrewteale.me.uk. Retrieved 5 November 2022.
- ^ "Local Elections Archive Project — Evesham North West Division". www.andrewteale.me.uk. Retrieved 21 November 2024.
External links
- County Council Elections. Worcestershire County Council.
| Bromsgrove | |
|---|---|
| Malvern Hills | |
| Redditch | |
| Worcester | |
| Wychavon | |
| Wyre Forest | |
| Hereford & Worcester CC |
|
| |
| Current | |
|---|---|
| Former | |
aUnitary authorities referred to as county councils | |