1925 Belgian general election|
|
|
|
|
First party
|
Second party
|
Third party
|
|
|
.jpg)
|
.jpg)
|

|
| Leader
|
Joseph Van Roosbroeck
|
Aloys Van de Vyvere
|
Édouard Pecher
|
| Party
|
Labour
|
Catholic
|
Liberal
|
| Leader since
|
1918
|
Candidate for PM
|
1924
|
| Last election
|
68 seats, 34.81%
|
70 seats, 34.02%
|
33 seats, 17.80%
|
| Seats won
|
78
|
78
|
23
|
| Seat change
|
 10 10
|
8
|
 10 10
|
| Popular vote
|
821,116
|
778,366
|
304,757
|
| Percentage
|
39.48%
|
37.42%
|
14.65%
|
| Swing
|
4.47%
|
3.40%
|
3.15%
|
|
|
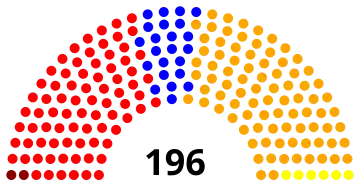
General elections were held in Belgium on 5 April 1925.[1] The result was a victory for the Belgian Labour Party, which won 78 of the 187 seats in the Chamber of Representatives.[2] Voter turnout was 92.8% in the Chamber election and 92.7% in the Senate election.[3]
An extra seat in the Chamber of Representatives was assigned to the arrondissement of Verviers, after the annexation of Eupen-Malmedy.
Following the elections, Aloys Van de Vyvere formed a Catholic minority government. After he failed to receive the confidence of the other parties in parliament, a Catholic-Labour government was formed led by Prosper Poullet.
Results
Chamber of Representatives
 |
|---|
| Party | Votes | % | Seats | +/– |
|---|
| Belgian Labour Party | 821,116 | 39.46 | 78 | +10 |
| Catholic Party | 778,366 | 37.41 | 78 | 0 |
| Liberal Party | 304,757 | 14.65 | 23 | –10 |
| Frontpartij | 80,407 | 3.86 | 6 | +2 |
| Communist Party of Belgium | 34,149 | 1.64 | 2 | +2 |
| Christian Workers' Alliance | 19,642 | 0.94 | 0 | 0 |
| Farmers | 16,106 | 0.77 | 0 | – |
| Middle Class Party | 9,999 | 0.48 | 0 | 0 |
| Christian Democrats | 4,450 | 0.21 | 0 | – |
| Legionnaires | 4,005 | 0.19 | 0 | – |
| Agricultural Unions | 2,966 | 0.14 | 0 | – |
| Radical Socialists | 2,117 | 0.10 | 0 | – |
| National Legion | 919 | 0.04 | 0 | – |
| Neutral | 731 | 0.04 | 0 | – |
| Walloon National Party | 642 | 0.03 | 0 | – |
| Independents | 281 | 0.01 | 0 | – |
| Total | 2,080,653 | 100.00 | 187 | +1 |
|
| Registered voters/turnout | 2,346,096 | – | |
|---|
| Source: Nohlen & Stöver, Belgian Elections[4] |
Senate
 |
|---|
| Party | Votes | % | Seats | +/– |
|---|
| Belgian Labour Party | 828,854 | 40.87 | 39 | +6 |
| Catholic Party | 757,804 | 37.36 | 38 | +4 |
| Liberal Party | 324,823 | 16.02 | 13 | –5 |
| Catholic dissidents | 52,286 | 2.58 | 3 | New |
| Frontpartij | 46,417 | 2.29 | 0 | 0 |
| Farmers | 5,800 | 0.29 | 0 | New |
| Middle Class Party | 1,965 | 0.10 | 0 | 0 |
| Radical Socialists | 1,486 | 0.07 | 0 | New |
| Catholic National Party | 1,332 | 0.07 | 0 | New |
| Walloon National Party | 654 | 0.03 | 0 | New |
| Independents | 6,776 | 0.33 | 0 | New |
| Total | 2,028,197 | 100.00 | 93 | 0 |
|
| Registered voters/turnout | 2,346,096 | – | |
|---|
| Source: Belgian Elections[5] |
References