1980 elections in India
| ||
|
| ||
| This article is part of a series on the |
| Politics of India |
|---|
 |
|
|
General Elections

Overall Result
Legislative Assembly elections
 | |||||
|---|---|---|---|---|---|
| Party | Votes | % | Seats | +/– | |
| Indian National Congress (Indira) | 72,734 | 42.58 | 13 | New | |
| People's Party of Arunachal | 70,006 | 40.98 | 13 | ||
| Indian National Congress (Urs) | 8,361 | 4.89 | 0 | New | |
| Independents | 19,716 | 11.54 | 4 | ||
| Total | 170,817 | 100.00 | 30 | 0 | |
| Valid votes | 170,817 | 94.87 | |||
| Invalid/blank votes | 9,235 | 5.13 | |||
| Total votes | 180,052 | 100.00 | |||
| Registered voters/turnout | 258,112 | 69.76 | |||
| Source: ECI[1] | |||||
 | ||||
|---|---|---|---|---|
| Party | Votes | % | Seats | |
| Indian National Congress | 7,690,225 | 34.20 | 169 | |
| Janata Party (Secular) | 3,515,684 | 15.63 | 42 | |
| Communist Party of India | 2,051,962 | 9.12 | 23 | |
| Bharatiya Janata Party | 1,891,325 | 8.41 | 21 | |
| Indian National Congress (U) | 1,649,695 | 7.34 | 14 | |
| Janata Party (JP) | 1,620,754 | 7.21 | 13 | |
| Communist Party of India (Marxist) | 394,013 | 1.75 | 6 | |
| Janata Party (Secular) Raj Narain | 362,388 | 1.61 | 1 | |
| Jharkhand Mukti Morcha | 380,891 | 1.69 | 11 | |
| Shoshit Samaj Dal (Akhil Bharatiya) | 128,517 | 0.57 | – | |
| Socialist Unity Centre of India (Communist) | 49,407 | 0.22 | 1 | |
| Jharkhand Party | 31,952 | 0.14 | – | |
| Revolutionary Socialist Party | 11,963 | 0.05 | – | |
| Lokdal | 6,744 | 0.03 | – | |
| Janata Party | 6,733 | 0.03 | – | |
| All India Forward Bloc | 5,309 | 0.02 | – | |
| Bharatiya Socialist Party | 1,102 | 0.00 | – | |
| Akhil Bharatiya Ram Rajya Parishad | 729 | 0.00 | – | |
| Republican Party of India | 568 | 0.00 | – | |
| Independent | 2,688,947 | 11.96 | 23 | |
| Total | 22,488,908 | 100.00 | 324 | |
| Valid votes | 22,488,908 | 98.62 | ||
| Invalid/blank votes | 315,496 | 1.38 | ||
| Total votes | 22,804,404 | 100.00 | ||
| Registered voters/turnout | 39,815,510 | 57.28 | ||
| Party | Votes | % | Seats | +/– |
|---|---|---|---|---|
| Indian National Congress (Urs) | 134,651 | 38.36 | 20 | New |
| Maharashtrawadi Gomantak Party | 127,714 | 36.36 | 7 | –8 |
| Janata Party | 14,431 | 4.11 | 0 | –3 |
| Indian National Congress | 12,338 | 3.51 | 0 | –10 |
| Janata Party (Secular) | 6,045 | 1.72 | 0 | New |
| Communist Party of India (Marxist) | 1,089 | 0.31 | 0 | New |
| Independents | 54,773 | 15.60 | 3 | +1 |
| Invalid/blank votes | 12,232 | – | – | – |
| Total | 363,273 | 100 | 30 | +1 |
| Registered voters/turnout | 522,652 | 69.51 | – | – |
| Source: Election Commission of India | ||||
 | |||||
|---|---|---|---|---|---|
| Party | Votes | % | Seats | +/– | |
| Indian National Congress (I) | 3,971,238 | 51.04 | 141 | New | |
| Janata Party | 1,771,853 | 22.77 | 21 | New | |
| Bharatiya Janata Party | 1,090,652 | 14.02 | 9 | New | |
| Janata Party (Secular) | 49,278 | 0.63 | 1 | New | |
| Others | 122,299 | 1.57 | 0 | 0 | |
| Independents | 775,813 | 9.97 | 10 | ||
| Total | 7,781,133 | 100.00 | 182 | 0 | |
| Valid votes | 7,781,133 | 97.48 | |||
| Invalid/blank votes | 200,862 | 2.52 | |||
| Total votes | 7,981,995 | 100.00 | |||
| Registered voters/turnout | 16,501,328 | 48.37 | |||
| Source: ECI[2] | |||||
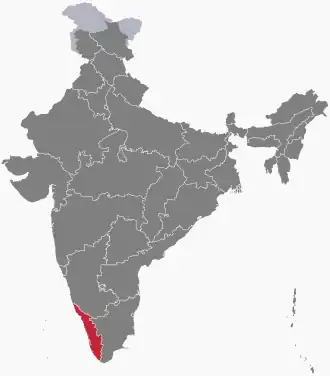
| |||||||||
|---|---|---|---|---|---|---|---|---|---|
| Party | Seats | Alliance | |||||||
| Communist Party of India (CPI) | 17 | Left Democratic Front | |||||||
| Communist Party of Indian (Marxist) (CPM) | 35 | ||||||||
| Indian National Congress (U) (INC (U)) | 21 | ||||||||
| Kerala Congress (Pillai Group) (KCP) | 1 | ||||||||
| Kerala Congress (M) (KCM) | 8 | ||||||||
| All India Muslim League (AIMUL) | 5 | ||||||||
| Revolutionary Socialist Party (RSP) | 6 | ||||||||
| Indian National Congress (I) (INC (I)) | 17 | United Democratic Front | |||||||
| Indian Union Muslim League (IUML) | 14 | ||||||||
| Kerala Congress (J) (KEC) | 6 | ||||||||
| Janata Party (JNP) | 5 | ||||||||
| National Democratic Party (NDP) | 3 | ||||||||
| Praja Socialist Party (PSP) | 1 | ||||||||
| Independent (IND) | 1 | N/A | |||||||
| Total | 140 | LDF-93, UDF-46, IND-1 | |||||||
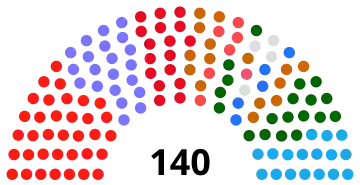
| SN | Party | Seats Contested |
Seats won |
Seats Changed |
% Votes |
|---|---|---|---|---|---|
| 1 | Indian National Congress (I) | 320 | 246 | 47.52% | |
| 2 | Bharatiya Janata Party | 310 | 60 | 30.34% | |
| 3 | Communist Party of India | 46 | 2 | 1.50% | |
| 4 | Janata Party | 124 | 2 | 2.88% | |
| 5 | Janata Party (Secular) | 204 | 1 | 4.82% | |
| 6 | Republican Party of India (Khobragade) | 13 | 1 | 0.33% | |
| 6 | Independent | 288 | 8 | 10.26% | |
| Total | 320 |
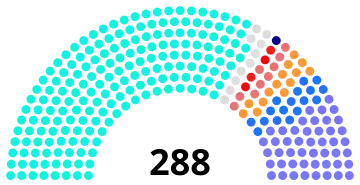
| |||||||||
|---|---|---|---|---|---|---|---|---|---|
| Political Party | Candidates | Seats won | Seat +/- | Votes | Vote % | Vote % +/- | |||
| Indian National Congress (Indira) 186 / 288 (65%) |
286 | 186 | 7,809,533 | 44.50% | |||||
| Indian National Congress (Urs) 47 / 288 (16%) |
192 | 47 | 3,596,582 | 20.49% | |||||
| Janata Party 17 / 288 (6%) |
111 | 17 | 1,511,042 | 8.61% | |||||
| Bharatiya Janata Party 14 / 288 (5%) |
145 | 14 | 1,645,734 | 9.38% | |||||
| Peasants and Workers Party of India 9 / 288 (3%) |
41 | 9 | 726,338 | 4.14% | |||||
| Communist Party of India 2 / 288 (0.7%) |
17 | 2 | 230,570 | 1.31% | |||||
| Communist Party of India (Marxist) 2 / 288 (0.7%) |
10 | 2 | 162,651 | 0.93% | |||||
| Republican Party of India (Khobragade) 1 / 288 (0.3%) |
42 | 1 | 239,286 | 1.36% | |||||
| Republican Party of India | 36 | 0 | 132,798 | 0.76% | |||||
| All India Forward Bloc | 1 | 0 | 5,598 | 0.03% | |||||
| Independents 10 / 288 (3%) |
612 | 10 | 1,409,177 | 8.03% | |||||
| Total | 1537 | 288 | 17,548,655 | 53.30% | |||||
 | |||||
|---|---|---|---|---|---|
| Party | Votes | % | Seats | +/– | |
| Indian National Congress (I) | 158,127 | 21.63 | 13 | New | |
| Janata Party | 144,112 | 19.71 | 10 | New | |
| Indian National Congress (U) | 69,319 | 9.48 | 6 | New | |
| Communist Party of India | 53,055 | 7.26 | 5 | –1 | |
| Manipur Peoples Party | 48,196 | 6.59 | 4 | –16 | |
| Janata Party (Secular) | 20,667 | 2.83 | 0 | New | |
| Kuki National Assembly | 20,600 | 2.82 | 2 | – | |
| Communist Party of India (Marxist) | 4,168 | 0.57 | 1 | +1 | |
| Janata Party (JP) | 924 | 0.13 | 0 | New | |
| Independents | 211,855 | 28.98 | 19 | +14 | |
| Total | 731,023 | 100.00 | 60 | 0 | |
| Valid votes | 731,023 | 97.55 | |||
| Invalid/blank votes | 18,381 | 2.45 | |||
| Total votes | 749,404 | 100.00 | |||
| Registered voters/turnout | 909,268 | 82.42 | |||
| Source: ECI[7] | |||||
| Political Party | Flag | Seats Contested |
Won | Net Change in seats |
% of Seats |
Votes | Vote % | Change in vote % | |
|---|---|---|---|---|---|---|---|---|---|
| Indian National Congress (I) | 147 | 118 | "NEW" | 80.27 | 30,37,487 | 47.78 | "NEW" | ||
| Indian National Congress (U) | 98 | 2 | "NEW" | 1.36 | 4,46,818 | 10.49 | "NEW" | ||
| Bharatiya Janata Party | 28 | 0 | NA | 0 | 86,421 | 7.09 | NA | ||
| Communist Party of India | 27 | 4 | 3.57 | 2,33,971 | 2.72 | ||||
| Independent | 248 | 7 | N/A | 4.76 | 7,55,087 | 15.77 | N/A | ||
| Total Seats | 147 ( |
Voters | 1,39,09,115 | Turnout | 65,49,074 (47.08%) | ||||
 | |||||
|---|---|---|---|---|---|
| Party | Votes | % | Seats | +/– | |
| Dravida Munnetra Kazhagam | 68,030 | 27.73 | 14 | ||
| Indian National Congress (Indira) | 58,680 | 23.92 | 10 | ||
| Janata Party | 22,892 | 9.33 | 3 | ||
| Communist Party of India (Marxist) | 4,944 | 2.02 | 1 | ||
| Others | 64,778 | 26.40 | 0 | 0 | |
| Independents | 26,001 | 10.60 | 2 | ||
| Total | 245,325 | 100.00 | 30 | 0 | |
| Valid votes | 245,325 | 95.60 | |||
| Invalid/blank votes | 11,278 | 4.40 | |||
| Total votes | 256,603 | 100.00 | |||
| Registered voters/turnout | 319,137 | 80.41 | |||
| Source: ECI[9] | |||||
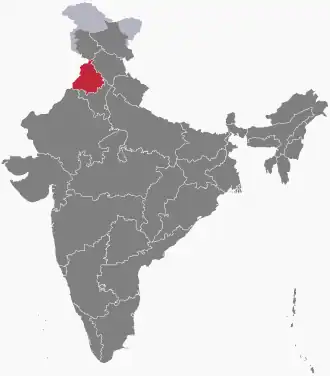
| Result of Punjab Legislative Assembly election 1980[10] | ||||||
|---|---|---|---|---|---|---|
| Party | contested | Seats won | change in seats | popular vote | % | |
| Indian National Congress | 117 | 63 | 28,25,827 | 45.19% | ||
| Shiromani Akali Dal | 73 | 37 | 16,83,266 | 26.92% | ||
| Communist Party of India | 18 | 9 | 4,03,718 | 6.46% | ||
| Communist Party of India (Marxist) | 13 | 5 | 2,53,985 | 4.06% | ||
| Bharatiya Janata Party | 41 | 1 | (new) | 4,05,106 | 6.48% | |
| Independents | 376 | 2 | 4,07,799 | 6.52% | ||
| Others | 84 | 0 | - | 2,73,215 | 4.36% | |
| Total | 722 | 117 | 62,52,916 | |||
 | |||||
|---|---|---|---|---|---|
| Party | Votes | % | Seats | +/– | |
| Indian National Congress (Indira) | 3,975,315 | 42.96 | 133 | New | |
| Bharatiya Janata Party | 1,721,321 | 18.60 | 32 | New | |
| Janata Party (Secular) | 883,926 | 9.55 | 7 | New | |
| Janata Party | 679,193 | 7.34 | 8 | New | |
| Indian National Congress (Urs) | 516,887 | 5.59 | 6 | New | |
| Communist Party of India (Marxist) | 111,476 | 1.20 | 1 | 0 | |
| Communist Party of India | 89,382 | 0.97 | 1 | 0 | |
| Janata Party (Secular - Raj Narain) | 63,321 | 0.68 | 0 | New | |
| Akhil Bharatiya Ram Rajya Parishad | 1,558 | 0.02 | 0 | 0 | |
| Republican Party of India | 55 | 0.00 | 0 | New | |
| Indian Union Muslim League | 35 | 0.00 | 0 | 0 | |
| Independents | 1,210,295 | 13.08 | 12 | +7 | |
| Total | 9,252,764 | 100.00 | 200 | 0 | |
| Valid votes | 9,252,764 | 98.20 | |||
| Invalid/blank votes | 169,206 | 1.80 | |||
| Total votes | 9,421,970 | 100.00 | |||
| Registered voters/turnout | 18,452,344 | 51.06 | |||
| Source: ECI[11] | |||||

| Alliance/Party | Seats won | Change | Popular Vote | Vote % | Adj. %‡ | |
|---|---|---|---|---|---|---|
| AIADMK+ alliance | 162 | +14 | 9,328,839 | 48.9% | ||
| AIADMK | 129 | -1 | 7,303,010 | 38.8% | 50.4% | |
| CPI(M) | 11 | -1 | 596,406 | 3.2% | 47.6% | |
| CPI | 9 | +4 | 501,032 | 2.7% | 43.9% | |
| GKC | 6 | +6 | 322,440 | 1.7% | 44.1% | |
| IND | 6 | +6 | 488,296 | 2.6% | ||
| FBL | 1 | – | 65,536 | 0.4% | 44.6% | |
| INC(U) | 0 | – | 52,119 | 0.3% | 29.3% | |
| DMK+ alliance | 69 | -6 | 8,371,718 | 44.4% | ||
| DMK | 37 | -11 | 4,164,389 | 22.1% | 45.7% | |
| INC(I) | 31 | +4 | 3,941,900 | 20.9% | 43.4% | |
| IND | 1 | +1 | 265,429 | 1.4% | ||
| Others | 3 | -8 | 1,144,449 | 6.1% | ||
| JNP(JP) | 2 | -8 | 522,641 | 2.8% | 6.9% | |
| IND | 1 | – | 598,897 | 3.2% | – | |
| Total | 234 | – | 18,845,006 | 100% | – | |
‡: Vote % reflects the percentage of votes the party received compared to the entire electorate that voted in this election. Adjusted (Adj.) Vote %, reflects the % of votes the party received per constituency that they contested.
Sources: Election Commission of India[12] and Keesing's Report[13]
| Party Name | Seats |
|---|---|
| Indian National Congress (INC) | 309 |
| Janata Party (Secular) (JNP (SC)) | 59 |
| Indian National Congress (U) (INC (U)) | 13 |
| Bharatiya Janata Party (BJP) | 11 |
| Communist Party of India (CPI) | 6 |
| Janata Party (JNP(JP)) | 4 |
| Janata Party (Secular) (JNP(SR)) | 4 |
| Soshit Samaj Dal (Akhil Bharatiya) (SSD) | 1 |
| Independent | 17 |
| Total | 425 |
References
- ^ Cite error: The named reference
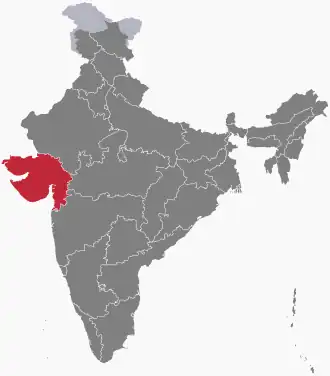
eciwas invoked but never defined (see the help page). - ^ "Statistical Report on Generlal Election, 1980 to the Legislative Assembly of Gujarat". Election Commission of India. Retrieved 1 August 2022.
- ^ Cite error: The named reference
:0was invoked but never defined (see the help page). - ^ "STATISTICAL REPORT ON GENERAL ELECTION, 1980 TO THE LEGISLATIVE ASSEMBLY OF MADHYA PRADESH". Election Commission of India. Retrieved 14 June 2018.
- ^ "Statistical Report on General Election, 1980 to the Legislative Assembly of Madhya Pradesh" (PDF). Madhya Pradesh, Chief Electoral Officer. Retrieved 9 December 2020.
- ^ "Statistical Report on General Election, 1980 to the Legislative Assembly of Goa". Election Commission of India.
- ^ "Statistical Report on General Election, 1980 to the Legislative Assembly of Manipur". Election Commission of India. Retrieved 22 October 2021.
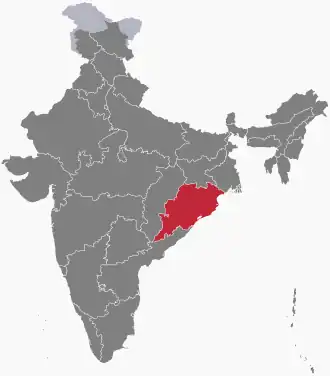
- ^ "Orissa 1980". Election Commission of India. Retrieved 28 May 2021.
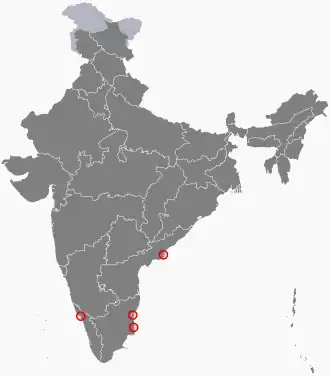
- ^ "Statistical Report on General Election, 1980 to the Legislative Assembly of Pondicherry". Election Commission of India. Retrieved 30 July 2022.
- ^ Punjab Assembly Election Results in 1980, Elections.in.
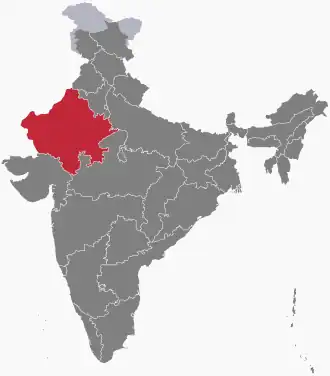
- ^ "Statistical Report on General Election, 1980 to the Legislative Assembly of Rajasthan". Election Commission of India. Retrieved 27 December 2021.
- ^ Election Commission of India. "1980 Election Statistical Report" (PDF). Archived from the original (PDF) on 6 October 2010. Retrieved 19 April 2009.
- ^ Keesing's Statistical Report
External links
Wikimedia Commons has media related to 1980 elections in India.
| General elections | |
|---|---|
| State elections |
|
| |