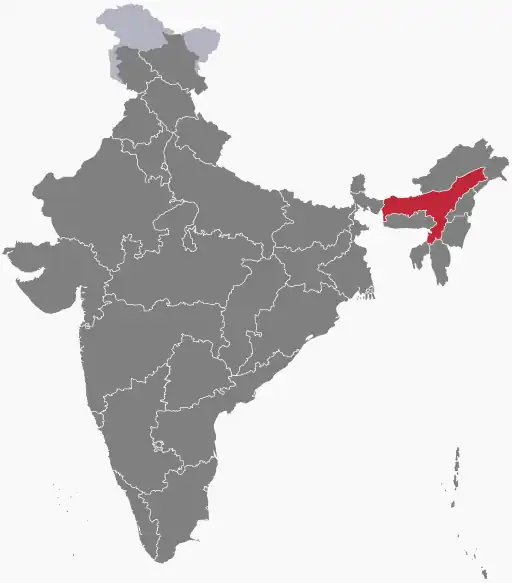
Elections in the Republic of India in 1985 included elections to fourteen state legislative assemblies.
Overall Result
Legislative Assembly elections
| Party |
Party Flag |
Seats Contested |
Seats Won |
Popular Vote |
Percentage
|
| Indian National Congress |
|
323 |
196 |
9,558,562 |
39.30%
|
| Lok Dal |
 |
261 |
46 |
3,573,173 |
14.69%
|
| Bharatiya Janata Party |
|
234 |
16 |
1,833,275 |
7.54%
|
| Janata Party |
|
229 |
13 |
1,754,705 |
7.21%
|
| Communist Party of India |
 |
167 |
12 |
2,154,066 |
8.86%
|
| Jharkhand Mukti Morcha |
|
57 |
9 |
443,822 |
1.82%
|
| Communist Party of India (Marxist) |
 |
44 |
1 |
392,375 |
1.61%
|
| Indian Congress (Socialist) |
|
59 |
1 |
160,159 |
0.66%
|
| Socialist Unity Centre of India |
 |
1 |
1 |
17,890 |
0.07%
|
| Independents |
|
2804 |
29 |
4,349,057 |
17.88%
|
| Total |
|
4237 |
324 |
24,323,868 |
|
Source:[1]
| Parties and coalitions
|
Popular vote
|
Seats
|
| Votes
|
%
|
Won
|
+/−
|
| Indian National Congress (INC)
|
5,122,753 |
55.55
|
149
|
+8
|
| Janata Party
|
1,775,338
|
19.25
|
14
|
-7
|
| Bharatiya Janata Party (BJP)
|
1,379,120
|
14.96
|
11 |
+2
|
| Independents (IND)
|
856,160 |
9.28
|
8 |
|
| CPM
|
16,543
|
0.18
|
0
|
0
|
| CPI
|
24,013
|
0.26
|
0
|
0
|
|
|
| Total
|
9,221,149 |
100.00
|
182 |
±0
|
|
|
| Valid votes
|
7,770,198
|
98.03
|
|
| Invalid votes
|
155,782
|
1.97
|
| Votes cast / turnout
|
13,676,131
|
51.59
|
| Registered voters
|
15,363,762
|
|
Source:[2]
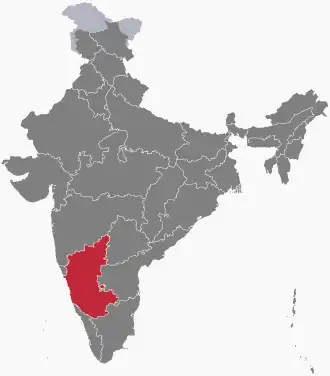
Summary of results of the Karnataka Legislative Assembly election, 1985[3]
|
|
Political Party
|
Seats Contested
|
Seats Won
|
Number of Votes
|
% of Votes
|
Seat change
|
|
|
Janata Party |
205 |
139 |
6,418,795 |
43.60% |
 44 44
|
|
|
Indian National Congress |
223 |
65 |
6,009,461 |
40.82% |
 17 17
|
|
|
Communist Party of India |
7 |
3 |
133,008 |
0.90% |

|
|
|
Bharatiya Janata Party |
116 |
2 |
571,280 |
3.88% |
16
|
|
|
Communist Party of India (Marxist) |
7 |
2 |
127,333 |
0.86% |
1
|
|
|
Independents |
1200 |
13 |
1,393,626 |
9.47% |
9
|
|
|
Total |
1795 |
224 |
14,720,634 |
|
|
Source:[4]
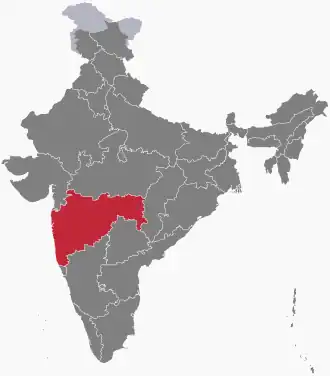
Summary of results of the Maharashtra State Assembly election, 1985[5]
|
|
Political Party
|
No. of candidates
|
No. of elected
|
Number of Votes
|
% of Votes
|
Seat change
|
|
|
Indian National Congress |
287 |
161 |
9,522,556 |
43.41% |
25
|
|
|
Indian National Congress (Socialist) |
126 |
54 |
3,790,850 |
17.28% |
54
|
|
|
Janata Party |
61 |
20 |
1,618,101 |
7.38% |
20
|
|
|
Bharatiya Janata Party |
67 |
16 |
1,590,351 |
7.25% |
2
|
|
|
Peasants and Workers Party of India |
29 |
13 |
825,949 |
3.77% |
4
|
|
|
Communist Party of India |
31 |
2 |
202,790 |
0.92% |
|
|
|
Communist Party of India (Marxist) |
14 |
2 |
174,350 |
0.79% |
|
|
|
Independents |
1506 |
20 |
3,836,390 |
17.49% |
10
|
|
|
Total |
2230 |
288 |
21,934,742 |
|
|
Summary of results of the 1985 Odisha Legislative Assembly election[6]
|
|
Political Party |
Flag |
Seats
Contested |
Won |
Net Change
in seats |
% of
Seats
|
Votes |
Vote % |
Change in
vote %
|
|
|
Indian National Congress
|
|
147 |
117
|
1 |
79.59 |
40,07,258 |
51.08 |
3.3
|
|
|
Communist Party of India (Marxist)
|
|
27 |
1 |
- |
0.68 |
89,225 |
15.97 |
-
|
|
|
Bharatiya Janata Party
|
|
67 |
1 |
1 |
0.68 |
2,04,346 |
5.66 |
1.43
|
|
|
Communist Party of India
|
|
27 |
1 |
3 |
0.68 |
2,59,508 |
16.12 |
13.4
|
|
|
Janata Party
|
|
140 |
21 |
- |
14.28 |
24,01,566 |
32.03 |
|
|
|
Independent
|
|
374 |
7 |
N/A |
4.76 |
8,23,850 |
11.54 |
N/A
|
|
|
Total Seats |
147 ( ) |
Voters |
1,53,37,200 |
Turnout |
80,16,583 (52.27%)
|
| Result of Punjab Legislative Assembly election 1985 [7]
|
|
|
Party
|
contested
|
Seats won
|
change in seats
|
popular vote
|
%
|
|
|
Shiromani Akali Dal
|
100
|
73
|
23
|
26,30,270
|
38.01
|
|
|
Indian National Congress
|
117
|
32
|
31
|
26,20,042
|
37.86
|
|
|
Bharatiya Janata Party
|
26
|
6
|
5
|
3,45,560
|
4.99
|
|
|
Communist Party of India
|
38
|
1
|
8
|
3,07,496
|
4.44
|
|
|
Janata Party
|
5
|
1
|
1
|
75,307
|
1.09
|
|
|
Independents
|
542
|
4
|
2
|
8,09,254
|
11.69
|
|
|
Others
|
29
|
0
|
-
|
1,32,889
|
1.92
|
|
|
Total
|
857
|
117
|
|
69,20,818
|
|
 |
|---|
| Party | Votes | % | Seats | +/– |
|---|
| Indian National Congress | 98,601 | 32.68 | 15 | 5 |
| Dravida Munnetra Kazhagam | 87,754 | 29.08 | 5 | 9 |
| All India Anna Dravida Munnetra Kazhagam | 47,521 | 15.75 | 6 | 6 |
| Janata Party | 25,966 | 8.61 | 2 | 1 |
| Others | 22,609 | 7.49 | 0 | 0 |
| Independents | 19,273 | 6.39 | 2 | 0 |
| Total | 301,724 | 100.00 | 30 | 0 |
|
| Valid votes | 301,724 | 99.08 | |
|---|
| Invalid/blank votes | 2,808 | 0.92 | |
|---|
| Total votes | 304,532 | 100.00 | |
|---|
| Registered voters/turnout | 388,472 | 78.39 | |
|---|
| Source: ECI[8] |
 |
|---|
| Party | Votes | % | Seats | +/– |
|---|
| Indian National Congress | 5,342,920 | 46.57 | 113 | –20 |
| Bharatiya Janata Party | 2,437,594 | 21.24 | 39 | +7 |
| Lok Dal | 1,360,826 | 11.86 | 27 | New |
| Janata Party | 675,103 | 5.88 | 10 | +2 |
| Communist Party of India | 141,063 | 1.23 | 1 | 0 |
| Indian National Congress (Jagjivan) | 74,176 | 0.65 | 0 | New |
| Communist Party of India (Marxist) | 66,921 | 0.58 | 0 | –1 |
| Indian Congress (Socialist) | 9,731 | 0.08 | 0 | New |
| Independents | 1,365,641 | 11.90 | 10 | –2 |
| Total | 11,473,975 | 100.00 | 200 | 0 |
|
| Valid votes | 11,473,975 | 98.40 | |
|---|
| Invalid/blank votes | 186,527 | 1.60 | |
|---|
| Total votes | 11,660,502 | 100.00 | |
|---|
| Registered voters/turnout | 21,228,702 | 54.93 | |
|---|
| Source: ECI[9] |
 |
|---|
| Party | Votes | % | Seats | +/– |
|---|
| Indian National Congress | 11,544,698 | 39.25 | 269 | –40 |
| Lok Dal | 6,304,455 | 21.43 | 84 | New |
| Bharatiya Janata Party | 2,890,884 | 9.83 | 16 | +5 |
| Janata Party | 1,646,005 | 5.60 | 20 | +16 |
| Communist Party of India | 894,620 | 3.04 | 6 | 0 |
| Indian National Congress (Jagjivan) | 669,031 | 2.27 | 5 | New |
| Doordarshi Party | 228,688 | 0.78 | 0 | New |
| Communist Party of India (Marxist) | 198,780 | 0.68 | 2 | 0 |
| Indian Congress (Socialist) | 88,616 | 0.30 | 0 | New |
| All India Forward Bloc | 4,074 | 0.01 | 0 | New |
| Revolutionary Socialist Party | 1,297 | 0.00 | 0 | New |
| Republican Party of India | 562 | 0.00 | 0 | 0 |
| Independents | 4,942,962 | 16.80 | 23 | +6 |
| Total | 29,414,672 | 100.00 | 425 | 0 |
|
| Valid votes | 29,414,672 | 98.53 | |
|---|
| Invalid/blank votes | 437,456 | 1.47 | |
|---|
| Total votes | 29,852,128 | 100.00 | |
|---|
| Registered voters/turnout | 65,404,531 | 45.64 | |
|---|
| Source: ECI[11] |
References
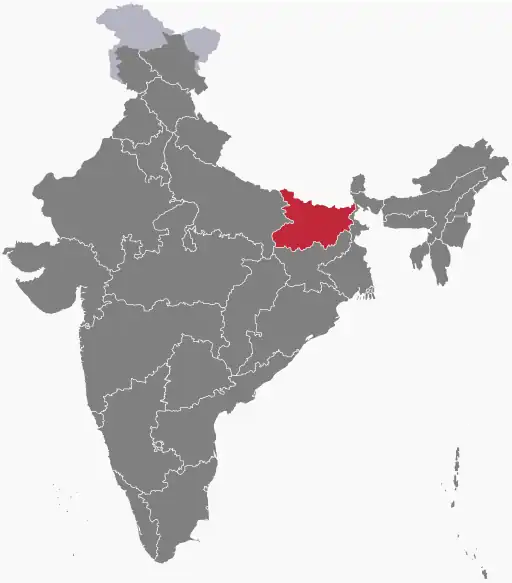
- ^ Election Commission of India. STATISTICAL REPORT ON GENERAL ELECTION, 1985 TO THE LEGISLATIVE ASSEMBLY OF BIHAR
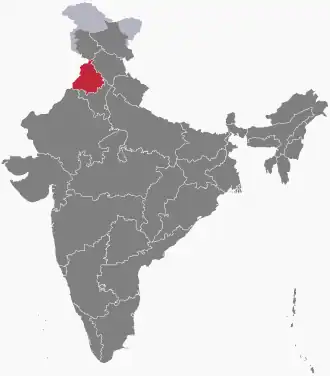
- ^ "STATISTICAL REPORT ON GENERAL ELECTION, 1985 TO THE LEGISLATIVE ASSEMBLY OF HIMACHAL PRADESH" (PDF).
- ^ "Statistical Report on General Election, 1985 to the Legislative Assembly of Karnataka, Election Commission of India" (PDF). Election Commission of India.
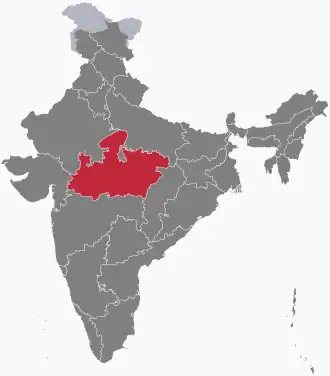
- ^ "STATISTICAL REPORT ON GENERAL ELECTION, 1985 TO THE LEGISLATIVE ASSEMBLY OF MADHYA PRADESH". eci.nic.in. Election Commission of India. Retrieved 27 May 2018.
- ^ "Key Highlights of General Election, 1985 to the Legislative Assembly of Maharashtra" (PDF). Election Commission of India.
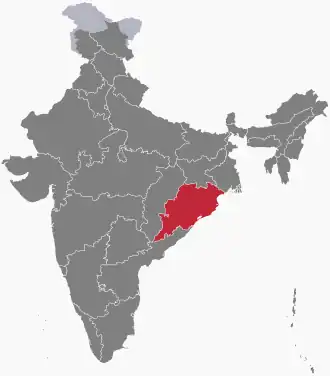
- ^ "Orissa 1985". Election Commission of India. Retrieved 17 June 2021.
- ^ "List of Polling Booth for Punjab Lok Sabha Elections 1985".
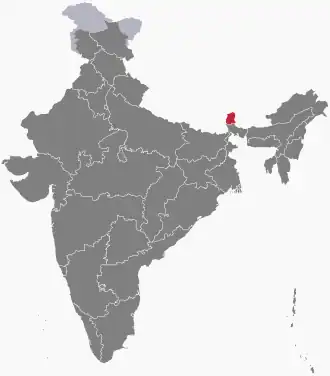
- ^ "Statistical Report on General Election, 1985 to the Legislative Assembly of Pondicherry". Election Commission of India. Retrieved 30 July 2022.
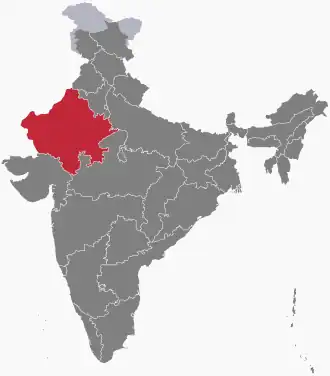
- ^ "Statistical Report on General Election, 1985 to the Legislative Assembly of Rajasthan". Election Commission of India. Retrieved 28 December 2021.
- ^ "Statistical Report on General Election, 1985 to the Legislative Assembly of Sikkim". Election Commission of India.
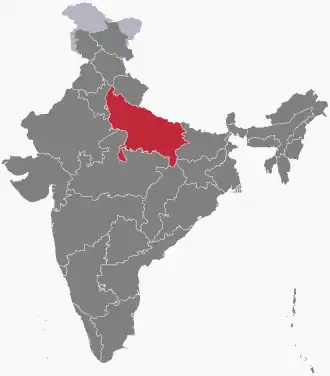
- ^ "Statistical Report on General Election, 1985 to the Legislative Assembly of Uttar Pradesh". Election Commission of India. Retrieved 16 January 2022.
External links
|
|---|
| General elections | |
|---|
| State elections | |
|---|
- See also: Elections in the Andaman and Nicobar Islands
- Andhra Pradesh
- Arunachal Pradesh
- Assam
- Bihar
- Chhattisgarh
- Chandigarh
- Delhi
- Goa
- Gujarat
- Haryana
- Himachal Pradesh
- Jammu and Kashmir
- Jharkhand
- Karnataka
- Kerala
- Madhya Pradesh
- Maharashtra
- Manipur
- Meghalaya
- Mizoram
- Nagaland
- Odisha
- Puducherry
- Punjab
- Rajasthan
- Sikkim
- Tamil Nadu
- Telangana
- Tripura
- Uttar Pradesh
- Uttarakhand
- West Bengal
Presidential elections
- Vice presidential elections
- Rajya Sabha elections
|